Ramona: Fire Incidents, California (CA)
Where are fire incidents reported in Ramona, CA
Something went wrong! Please refresh the page.
| Fire incidents reported | |
|---|---|
| Sreet name | Count |
| BLACK CANYON RD | 168 |
| MAIN ST | 94 |
| BLACK CANYON | 88 |
| HIGHLAND VALLEY RD | 88 |
| MONTECITO RD | 84 |
| HANSON LN | 60 |
| SAN VICENTE RD | 56 |
| 14TH ST | 40 |
| DYE RD | 40 |
| PILE ST | 38 |
| HWY 78 | 36 |
| PAMO RD | 32 |
| 10TH ST | 30 |
| B ST | 30 |
| BANDY CANYON | 30 |
| HWY 67 | 30 |
| 11TH ST | 28 |
| LA BREA ST | 28 |
| OLD JULIAN HWY | 28 |
| ASH ST | 26 |
| STEFFY RD | 26 |
| ASHLEY RD | 24 |
| EAGLE CREST RD | 24 |
| CEDAR ST | 22 |
| H ST | 22 |
| MAPLE ST | 22 |
| ORANGE AVE | 22 |
| 12TH ST | 20 |
| D ST | 20 |
| HIGHWAY 78 HWY | 20 |
| Other | 79 |
2005 - 2018 National Fire Incident Reporting System (NFIRS) incidents
- Incident types reported to NFIRS in Ramona, CA
- 7,32670.7%Rescue & EMS
- 1,35513.1%Fire
- 6135.9%Service Call
- 4684.5%False Alarm
- 3373.3%Good Intent Call
- 2562.5%Hazardous Condition
- Fire incident types reported to NFIRS in Ramona, CA
- 51437.9%Outside Fires
- 41930.9%Structure Fires
- 29521.8%Other
- 1279.4%Mobile Property/Vehicle Fires
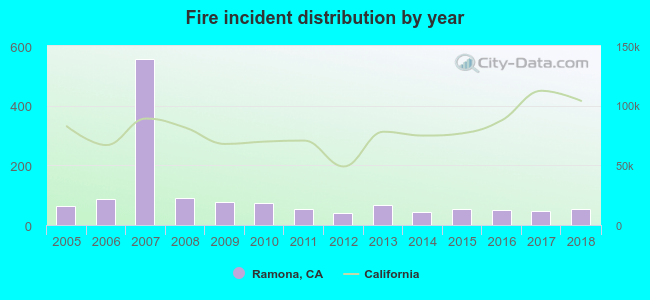 According to the data from the years 2005 - 2018 the average number of fires per year is 97. The highest number of reported fire incidents - 555 took place in 2007, and the least - 41 in 2012. The data has a declining trend.
The average number of yearly fire incidents per 10k residents in Ramona, CA compared to nearest cities:
(Note: Based on data for the last 3 years, including only cities with population 5,000 and above)
| Ramona: | 24.5 |
| Poway: | 16.2 |
| Lakeside: | 55.2 |
| Escondido: | 17.9 |
| Santee: | 16.9 |
| Alpine: | 48.0 |
| Valley Center: | 73.3 |
| El Cajon: | 14.4 |
| San Marcos: | 15.0 |
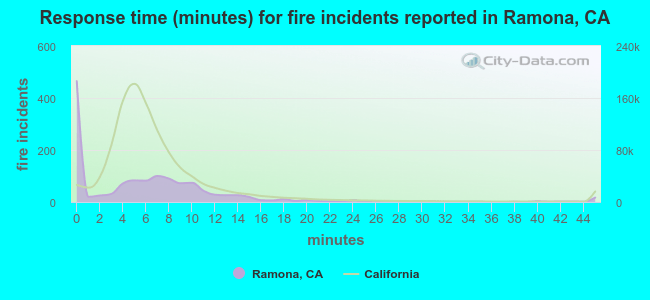 The median response time based on all reported fire incidents is 5 minutes. This is lower compared to the California median value.
The median response time in Ramona, CA compared to nearest cities:
(Note: Based on data for all years, including only cities with at least 500 fire incidents)
| Ramona: | 5 minutes |
| Lakeside: | 8 minutes |
| Escondido: | 6 minutes |
| Santee: | 7 minutes |
| Alpine: | 9 minutes |
| El Cajon: | 6 minutes |
| San Marcos: | 6 minutes |
| Rancho Santa Fe: | 6 minutes |
| La Mesa: | 6 minutes |
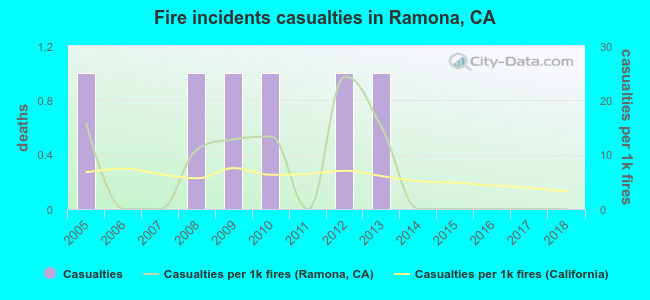 Based on the reports from the years 2005 - 2018 the average number of fire-related yearly casualties is 0. The highest number of injuries - 1 took place in 2005, and the lowest - 0 in 2006. The data has a decreasing trend.
The average number of injuries per 1,000 fire incidents is 7. This indicator was the highest - 24 in 2012, and the lowest 0 in 2006. The trend for casualties per 1,000 incidents is dropping. Compared to the state value the number of casualties per 1,000 fire incidents is lower.
Based on the reports from the years 2005 - 2018 the average number of fire-related yearly casualties is 0. The highest number of injuries - 1 took place in 2005, and the lowest - 0 in 2006. The data has a decreasing trend.
The average number of injuries per 1,000 fire incidents is 7. This indicator was the highest - 24 in 2012, and the lowest 0 in 2006. The trend for casualties per 1,000 incidents is dropping. Compared to the state value the number of casualties per 1,000 fire incidents is lower.Casualties per 1,000 incidents in Ramona, CA compared to nearest cities:
(Note: Based on data for all years, including only cities with at least 500 fire incidents)
| Ramona: | 4.4 |
| Lakeside: | 0.0 |
| Escondido: | 25.9 |
| Santee: | 3.7 |
| Alpine: | 2.9 |
| El Cajon: | 0.4 |
| San Marcos: | 26.8 |
| Rancho Santa Fe: | 1.7 |
| La Mesa: | 0.0 |
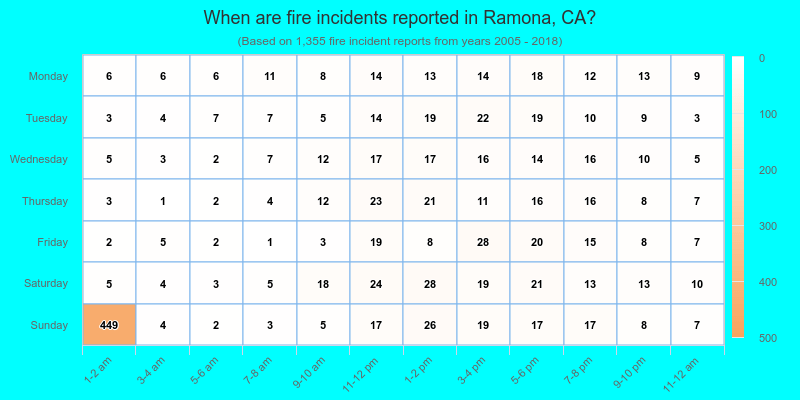
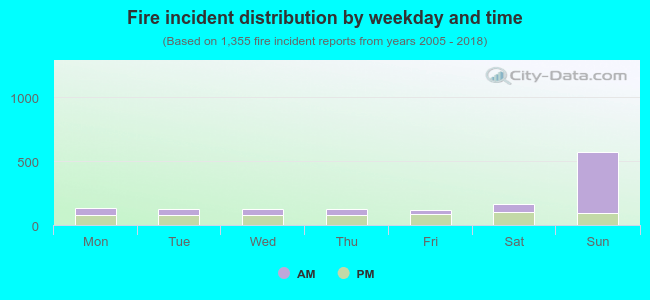 55.6% incidents where reported in the morning and 44.4% in the evening. The most fires (42.4%) took place on Sunday, and the least (8.7%) on Friday.
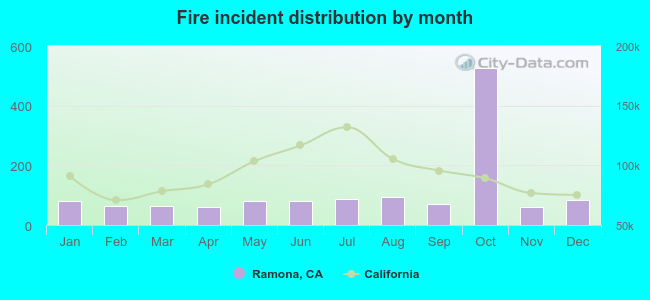 Based on the 1,355 fire incident reports from years 2005 - 2018 most fires (38.9%) took place during October, and the least (4.4%) in April.
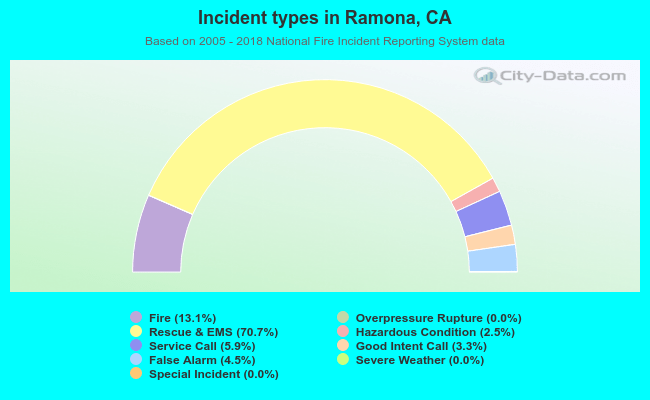 Out of all 10,366 cases reported during the years 2005 - 2018, the most belonged to the categories: Rescue & EMS (70.7%), Fire (13.1%), and Service Call (5.9%).
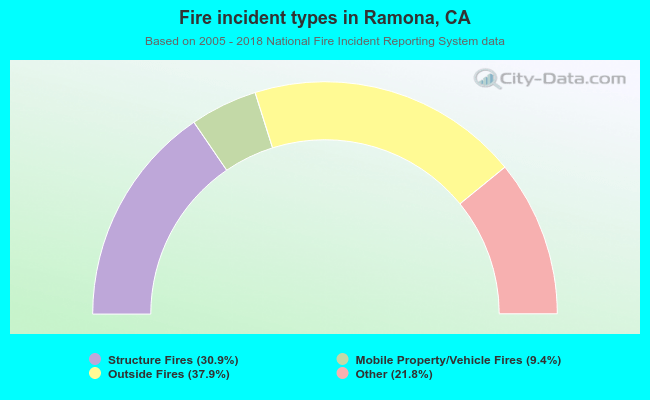 When looking into fire subcategories, the most incidents belonged to: Outside Fires (37.9%), and Structure Fires (30.9%).