Reynoldsburg: Fire Incidents, Ohio (OH)
Where are fire incidents reported in Reynoldsburg, OH
Something went wrong! Please refresh the page.
| Fire incidents reported | |
|---|---|
| Sreet name | Count |
| MAIN ST | 160 |
| TAYLOR RD | 128 |
| BRICE RD | 70 |
| LIVINGSTON AVE | 62 |
| BROAD ST | 42 |
| ROSEHILL RD | 42 |
| COMMONS RD | 38 |
| BRIARCLIFF RD | 36 |
| MARLAN AVE | 34 |
| NATIONAL RD | 34 |
| E MAIN ST | 32 |
| LANCASTER AVE | 32 |
| TREEBOURNE DR | 30 |
| BRICE RD | 28 |
| TAYLOR PARK DR | 28 |
| CENTURY CITY | 26 |
| BALDWIN PL | 24 |
| BALDWIN RD | 24 |
| BIRCHVIEW DR | 22 |
| BRIARCLIFF RD | 22 |
| HILTON DR | 22 |
| MEADOWLARK LN | 20 |
| PALMER RD | 20 |
| POSTWOODS DR | 20 |
| TRIBUTARY LN | 20 |
| WAGGONER RD | 20 |
| E LIVINGSTON AVE | 18 |
| RETTON RD | 18 |
| SAN MIGUEL PL | 18 |
| TRILLIUM LN | 18 |
| Other | 325 |
2002 - 2018 National Fire Incident Reporting System (NFIRS) incidents
- Incident types reported to NFIRS in Reynoldsburg, OH
- 10,95159.8%Rescue & EMS
- 2,36712.9%Good Intent Call
- 1,6819.2%Hazardous Condition
- 1,4337.8%Fire
- 9295.1%False Alarm
- 9014.9%Service Call
- 210.1%Overpressure Rupture
- Fire incident types reported to NFIRS in Reynoldsburg, OH
- 88261.5%Structure Fires
- 38727.0%Outside Fires
- 14910.4%Mobile Property/Vehicle Fires
- 151.0%Other
 According to the data from the years 2002 - 2018 the average number of fire incidents per year is 84. The highest number of reported fires - 116 took place in 2013, and the least - 12 in 2003. The data has an increasing trend.
The average number of yearly fire incidents per 10k residents in Reynoldsburg, OH compared to nearest cities:
(Note: Based on data for the last 3 years, including only cities with population 5,000 and above)
| Reynoldsburg: | 28.7 |
| Whitehall: | 50.3 |
| Pickerington: | 30.2 |
| Gahanna: | 20.2 |
| Pataskala: | 73.5 |
| Bexley: | 9.6 |
| Canal Winchester: | 90.9 |
| New Albany: | 42.0 |
| Groveport: | 111.7 |
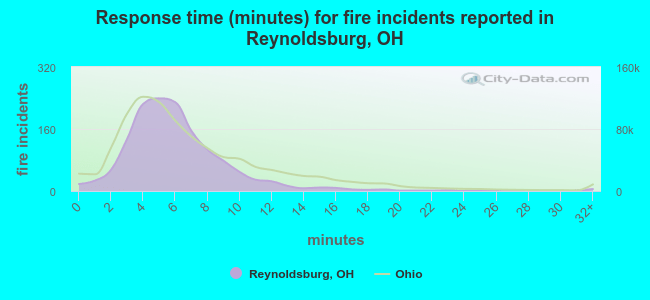 The median response time based on all reported fire incidents is 6 minutes. This is close to the Ohio median value.
The median response time in Reynoldsburg, OH compared to nearest cities:
(Note: Based on data for all years, including only cities with at least 500 fire incidents)
| Reynoldsburg: | 6 minutes |
| Whitehall: | 4 minutes |
| Pickerington: | 6 minutes |
| Gahanna: | 5 minutes |
| Pataskala: | 7 minutes |
| Canal Winchester: | 5 minutes |
| Groveport: | 5 minutes |
| Columbus: | 4 minutes |
| Carroll: | 8 minutes |
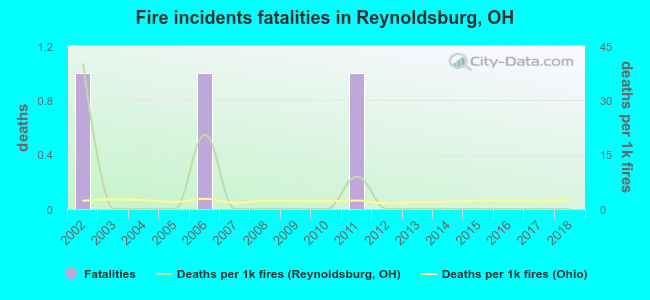 Based on the reports from the years 2002 - 2018 the average number of fire-related fatalities per year is 0. The highest number of reported deaths - 1 took place in 2002, and the lowest - 0 in 2003. The data has a decreasing trend.
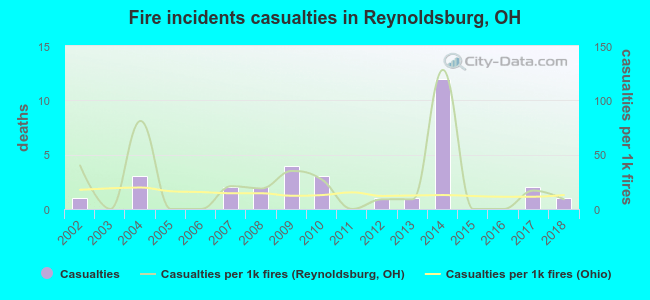 According to the reports from the years 2002 - 2018 the average number of fire-related yearly casualties is 2. The highest number of injuries - 12 took place in 2014, and the lowest - 0 in 2003. The data has a constant trend.
The average number of injuries per 1,000 fire incidents is 23. This indicator was the highest - 128 in 2014, and the lowest 0 in 2003. The trend for injuries per 1,000 fires is dropping. Compared to the Ohio value the number of casualties per 1,000 fire incidents is higher.
According to the reports from the years 2002 - 2018 the average number of fire-related yearly casualties is 2. The highest number of injuries - 12 took place in 2014, and the lowest - 0 in 2003. The data has a constant trend.
The average number of injuries per 1,000 fire incidents is 23. This indicator was the highest - 128 in 2014, and the lowest 0 in 2003. The trend for injuries per 1,000 fires is dropping. Compared to the Ohio value the number of casualties per 1,000 fire incidents is higher.Casualties per 1,000 incidents in Reynoldsburg, OH compared to nearest cities:
(Note: Based on data for all years, including only cities with at least 500 fire incidents)
| Reynoldsburg: | 22.3 |
| Whitehall: | 9.9 |
| Pickerington: | 15.8 |
| Gahanna: | 7.5 |
| Pataskala: | 22.3 |
| Canal Winchester: | 5.9 |
| Groveport: | 14.2 |
| Columbus: | 13.4 |
| Carroll: | 1.3 |
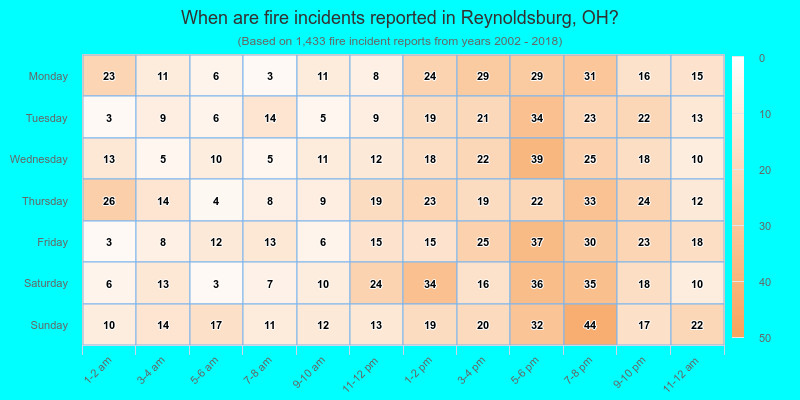
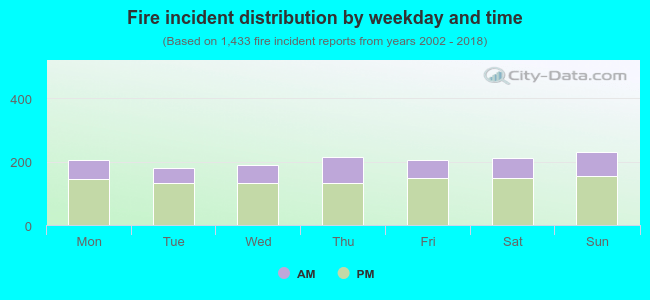 30.8% incidents where reported in the morning and 69.2% in the evening. The most fires (16.1%) took place on Sunday, and the least (12.4%) on Tuesday.
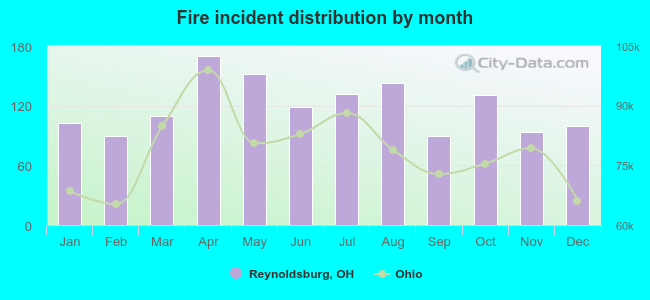 Based on the 1,433 fire incidents from years 2002 - 2018 most fires (11.9%) took place during April, and the least (6.2%) in February.
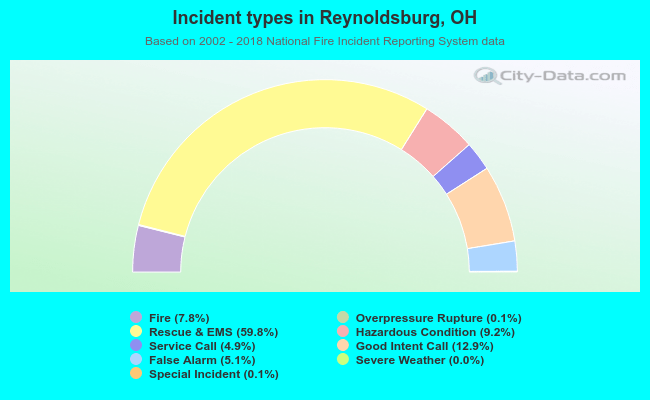 Out of all 18,299 cases reported during the years 2002 - 2018, the most belonged to the categories: Rescue & EMS (59.8%), Good Intent Call (12.9%), and Hazardous Condition (9.2%).
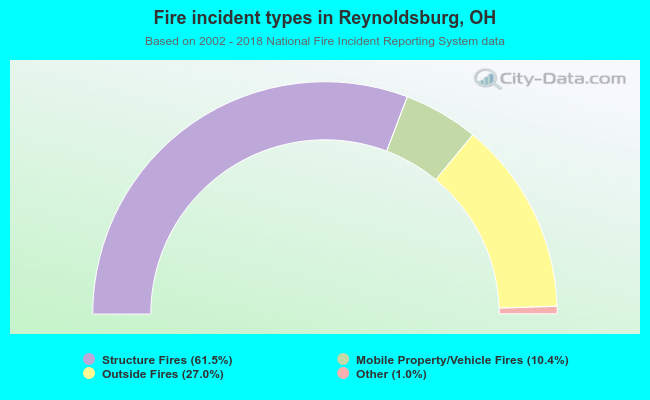 When looking into fire subcategories, the most reports belonged to: Structure Fires (61.5%), and Outside Fires (27.0%).