| Fire incidents reported |
|---|
| Sreet name | Count |
|---|
| ROUTE 9 | 18 | | ROUTE 9G | 16 | | RIVER RD | 12 | | SLATE QUARRY RD | 12 | | LAKE DR | 10 | | MILL ST | 10 | | MOUNTAIN LAUREL LN | 10 | | MORTON RD | 8 | | RHINECLIFF RD | 8 | | ROUTE 308 | 8 | | BROOKMEADE DR | 6 | | CEDAR HEIGHTS RD | 6 | | CEDAR HEIGHTS RD | 6 | | E MARKET ST | 6 | | KERR RD | 6 | | LOFTUS RD | 6 | | MILL ST | 6 | | MILLER RD | 6 | | MONTGOMERY ST | 6 | | RHINECLIFF RD | 6 | | WURTEMBURG RD | 6 | | ACKERT HOOK RD | 4 | | EAST KNOLL | 4 | | ENTERPRISE RD | 4 | | HIDDEN VALLEY RD | 4 |
| | | Fire incidents reported |
|---|
| Sreet name | Count |
|---|
| LIVINGSTON ST | 4 | | LOFTUS ROAD | 4 | | LOSEE LN | 4 | | LOWER HOOK RD | 4 | | MARKET ST | 4 | | MILL RD | 4 | | MILL RD | 4 | | MOUNT RUTSEN RD | 4 | | MOUNTAIN LAUREL LANE | 4 | | OAK ST | 4 | | PRIMROSE HILL RD | 4 | | RED TAIL RD | 4 | | RIVER RD | 4 | | ROUTE 199 | 4 | | ROUTE 199 RT | 4 | | ROUTE 9 RT | 4 | | SALISBURY TPKE | 4 | | SALISBURY TRNP | 4 | | SILVER LAKE RD | 4 | | SOUTHLANDS DR | 4 | | SPRING BROOK AVENUE | 4 | | VILLAGE GREEN | 4 | | WILL TREMPER DR | 4 | | WURTEMBURG RD | 4 | | 308 RTE | 2 |
|
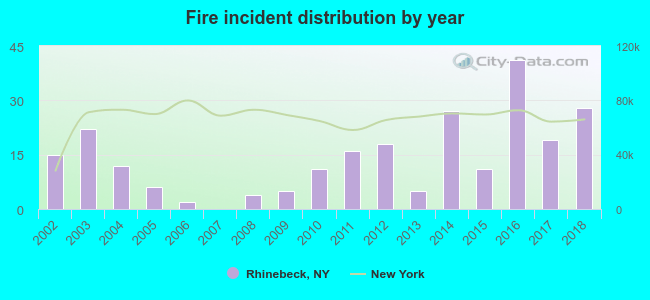 Based on the data from the years 2002 - 2018 the average number of fire incidents per year is 14. The highest number of fire incidents - 41 took place in 2016, and the least - 0 in 2007. The data has an increasing trend.
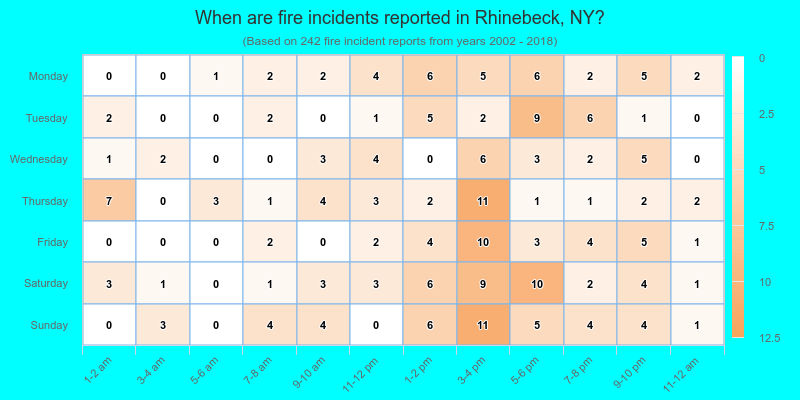
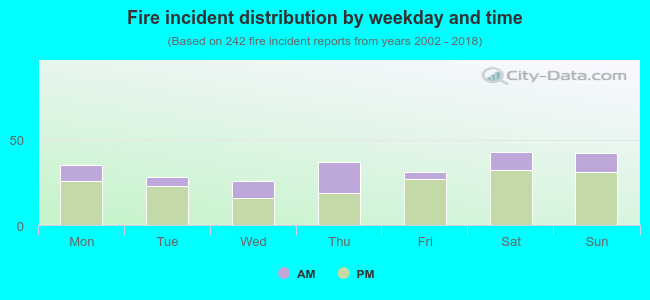 28.1% incidents where reported in the morning and 71.9% in the evening. The most fires (17.8%) took place on Saturday, and the least (10.7%) on Wednesday.
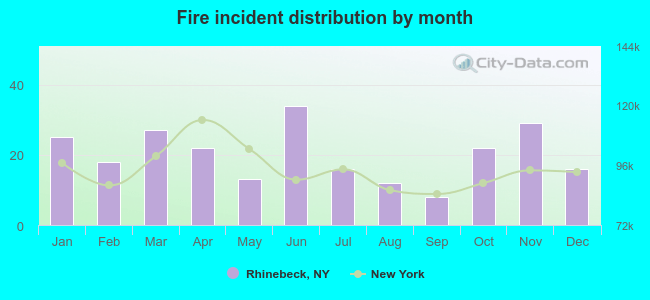 According to the 242 fire incidents from years 2002 - 2018 most fires (14.0%) took place during June, and the least (3.3%) in September.
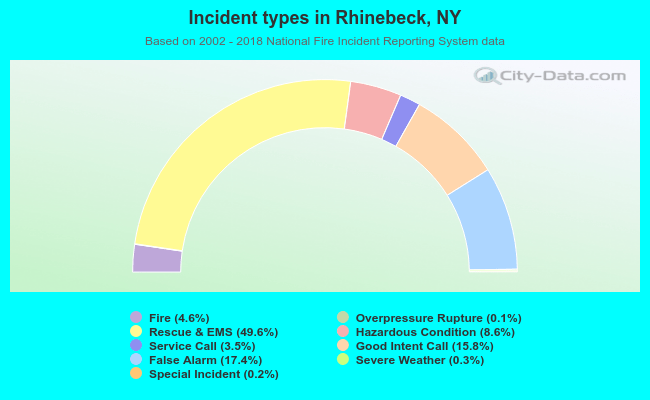 Out of all 5,233 cases reported during the years 2002 - 2018, the most belonged to the categories: Rescue & EMS (49.6%), False Alarm (17.4%), and Good Intent Call (15.8%).
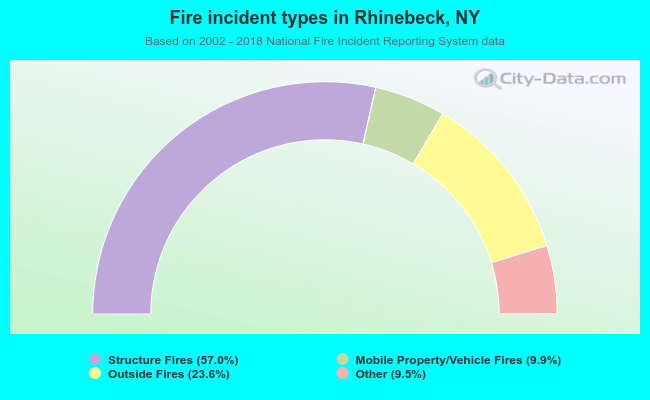 When looking into fire subcategories, the most reports belonged to: Structure Fires (57.0%), and Outside Fires (23.6%).