Richland: Fire Incidents, Washington (WA)
Where are fire incidents reported in Richland, WA
Something went wrong! Please refresh the page.
| Fire incidents reported | |
|---|---|
| Sreet name | Count |
| GEORGE WASHINGTON WAY | 376 |
| JADWIN AVE | 212 |
| STEVENS DR | 206 |
| SR 240 HWY | 182 |
| COLUMBIA PARK TRL | 164 |
| VAN GIESEN ST | 138 |
| DUPORTAIL ST | 134 |
| GAGE BLVD | 128 |
| GOETHALS DR | 106 |
| THAYER DR | 104 |
| COLUMBIA POINT DR | 76 |
| I-182 FWY | 76 |
| FOWLER ST | 74 |
| SANFORD AVE | 68 |
| QUEENSGATE DR | 58 |
| WRIGHT AVE | 58 |
| LESLIE RD | 56 |
| PIKE AVE | 56 |
| WELLSIAN WAY | 56 |
| SWIFT BLVD | 52 |
| COTTONWOOD DR | 50 |
| KEENE RD | 50 |
| TWIN BRIDGES RD | 50 |
| I182 FWY | 48 |
| LEE BLVD | 46 |
| DELAFIELD AVE | 44 |
| HORN RAPIDS RD | 44 |
| SAINT ST | 44 |
| ADAMS ST | 42 |
| COLUMBIA CENTER BLVD | 42 |
| Other | 489 |
2002 - 2018 National Fire Incident Reporting System (NFIRS) incidents
- Incident types reported to NFIRS in Richland, WA
- 19,99964.4%Rescue & EMS
- 3,32910.7%Fire
- 3,0039.7%Good Intent Call
- 1,8045.8%False Alarm
- 1,6705.4%Service Call
- 1,2003.9%Hazardous Condition
- 360.1%Special Incident
- Fire incident types reported to NFIRS in Richland, WA
- 1,44243.3%Structure Fires
- 1,23537.1%Outside Fires
- 49815.0%Mobile Property/Vehicle Fires
- 1544.6%Other
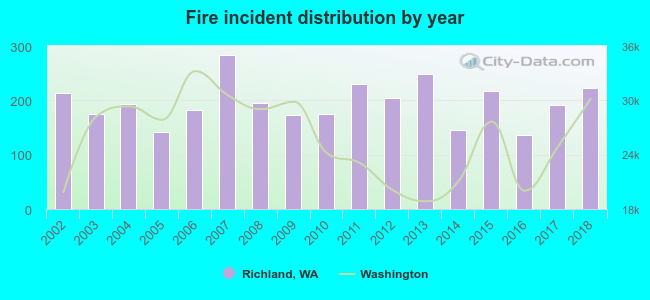 Based on the data from the years 2002 - 2018 the average number of fire incidents per year is 196. The highest number of fires - 284 took place in 2007, and the least - 136 in 2016. The data has a rising trend.
The average number of yearly fire incidents per 10k residents in Richland, WA compared to nearest cities:
(Note: Based on data for the last 3 years, including only cities with population 5,000 and above)
| Richland: | 34.6 |
| West Richland: | 39.9 |
| Kennewick: | 54.0 |
| Pasco: | 47.5 |
| Finley: | 8.3 |
| Prosser: | 144.2 |
| Grandview: | 44.6 |
| Connell: | 17.9 |
| Sunnyside: | 59.9 |
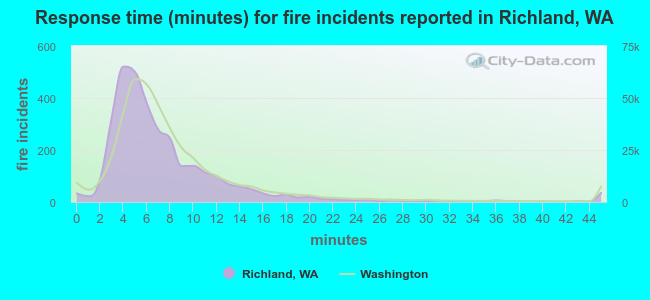 The median response time based on all reported fire incidents is 6 minutes. This is similar to the Washington median value.
The median response time in Richland, WA compared to nearest cities:
(Note: Based on data for all years, including only cities with at least 500 fire incidents)
| Richland: | 6 minutes |
| West Richland: | 8 minutes |
| Kennewick: | 7 minutes |
| Pasco: | 7 minutes |
| Benton City: | 9 minutes |
| Burbank: | 9 minutes |
| Prosser: | 8 minutes |
| Grandview: | 11 minutes |
| Hermiston: | 7 minutes |
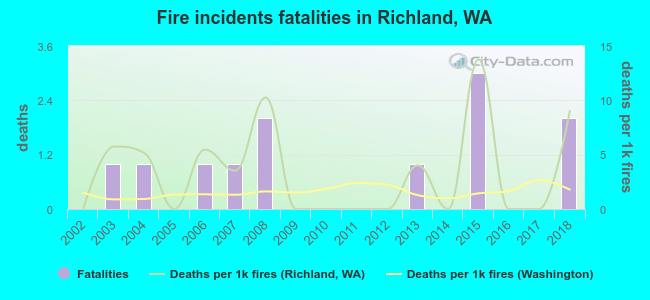 According to the reports from the years 2002 - 2018 the average number of fire-related yearly deaths is 1. The highest number of reported deaths - 3 took place in 2015, and the lowest - 0 in 2002. The data has a growing trend.
The average number of fatalities per 1,000 fire incidents is 3. This indicator was the highest - 14 in 2015, and the lowest 0 in 2002. The trend for fatalities per 1,000 fire incidents is growing. Compared to the Washington value the number of deaths per 1,000 fire incidents is much higher.
According to the reports from the years 2002 - 2018 the average number of fire-related yearly deaths is 1. The highest number of reported deaths - 3 took place in 2015, and the lowest - 0 in 2002. The data has a growing trend.
The average number of fatalities per 1,000 fire incidents is 3. This indicator was the highest - 14 in 2015, and the lowest 0 in 2002. The trend for fatalities per 1,000 fire incidents is growing. Compared to the Washington value the number of deaths per 1,000 fire incidents is much higher.Deaths per 1,000 incidents in Richland, WA compared to nearest cities:
(Note: Based on data for all years, including only cities with at least 2,500 fire incidents)
| Richland: | 3.6 |
| Kennewick: | 1.2 |
| Pasco: | 0.4 |
| Wapato: | 2.6 |
| Moses Lake: | 1.9 |
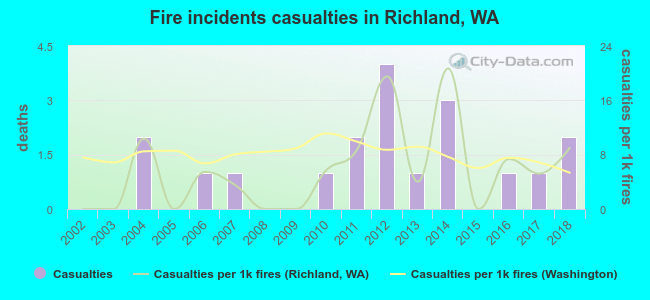 Based on the data from the years 2002 - 2018 the average number of fire-related casualties per year is 1. The highest number of reported injuries - 4 took place in 2012, and the lowest - 0 in 2002. The data has a growing trend.
The average number of injuries per 1,000 fire incidents is 6. This indicator was the highest - 21 in 2014, and the lowest 0 in 2002. The trend for injuries per 1,000 fires is rising. Compared to the state value the number of casualties per 1,000 fire incidents is lower.
Based on the data from the years 2002 - 2018 the average number of fire-related casualties per year is 1. The highest number of reported injuries - 4 took place in 2012, and the lowest - 0 in 2002. The data has a growing trend.
The average number of injuries per 1,000 fire incidents is 6. This indicator was the highest - 21 in 2014, and the lowest 0 in 2002. The trend for injuries per 1,000 fires is rising. Compared to the state value the number of casualties per 1,000 fire incidents is lower.Casualties per 1,000 incidents in Richland, WA compared to nearest cities:
(Note: Based on data for all years, including only cities with at least 500 fire incidents)
| Richland: | 5.7 |
| West Richland: | 7.3 |
| Kennewick: | 3.5 |
| Pasco: | 4.9 |
| Benton City: | 5.9 |
| Burbank: | 3.3 |
| Prosser: | 0.0 |
| Grandview: | 4.2 |
| Hermiston: | 11.4 |
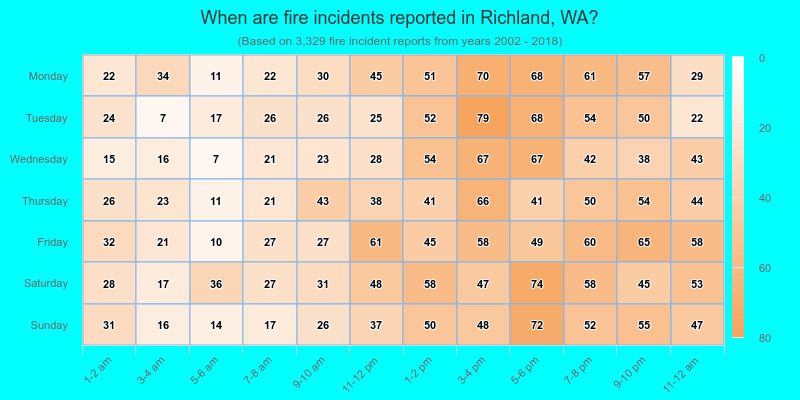
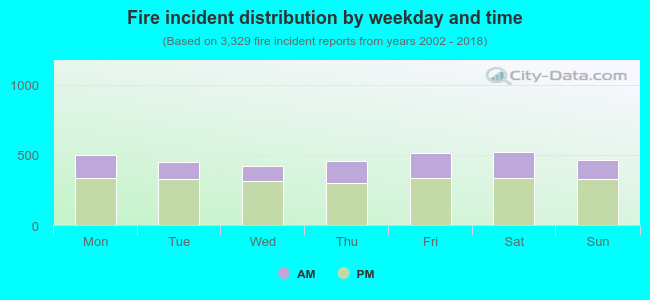 32.1% incidents where reported in the morning and 67.9% in the evening. The most fires (15.7%) took place on Saturday, and the least (12.6%) on Wednesday.
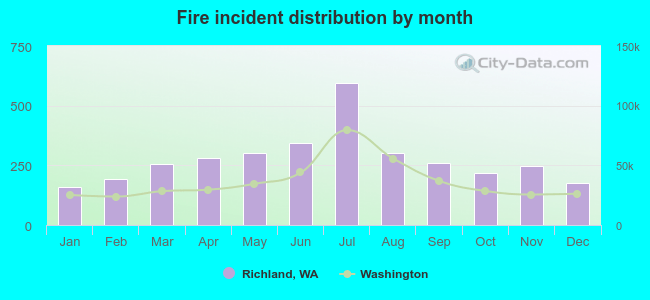 Based on the 3,329 incident reports from years 2002 - 2018 most fires (17.9%) took place during July, and the least (4.8%) in January.
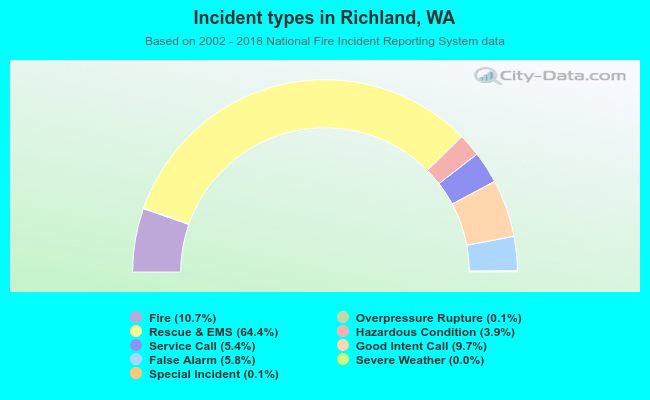 Out of all 31,073 cases reported during the years 2002 - 2018, the most belonged to the categories: Rescue & EMS (64.4%), Fire (10.7%), and Good Intent Call (9.7%).
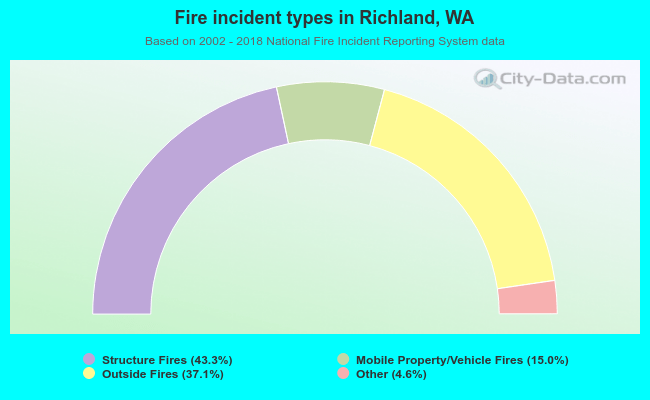 When looking into fire subcategories, the most incidents belonged to: Structure Fires (43.3%), and Outside Fires (37.1%).