Ripley: Fire Incidents, Mississippi (MS)
Where are fire incidents reported in Ripley, MS
Something went wrong! Please refresh the page.
|
| |||||||||||||||||||||||||||||||||||||||||||||||||||||||||||||||||||||||||||||||||||||||||||||||||||||||||||||
| Other | 462 | |||||||||||||||||||||||||||||||||||||||||||||||||||||||||||||||||||||||||||||||||||||||||||||||||||||||||||||
2003 - 2018 National Fire Incident Reporting System (NFIRS) incidents
- Incident types reported to NFIRS in Ripley, MS
- 1,80287.9%Fire
- 864.2%Good Intent Call
- 753.7%Rescue & EMS
- 281.4%Service Call
- 271.3%Hazardous Condition
- 251.2%False Alarm
- 40.2%Special Incident
- Fire incident types reported to NFIRS in Ripley, MS
- 93251.7%Outside Fires
- 59733.1%Structure Fires
- 24913.8%Mobile Property/Vehicle Fires
- 241.3%Other
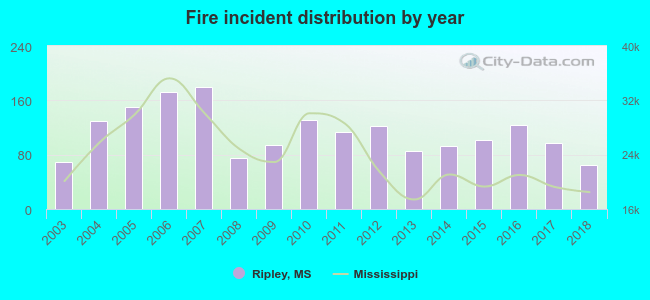 Based on the data from the years 2003 - 2018 the average number of fire incidents per year is 113. The highest number of reported fire incidents - 180 took place in 2007, and the least - 65 in 2018. The data has a decreasing trend.
The average number of yearly fire incidents per 10k residents in Ripley, MS compared to nearest cities:
(Note: Based on data for the last 3 years, including only cities with population 5,000 and above)
| Ripley: | 177.6 |
| New Albany: | 165.4 |
| Booneville: | 373.3 |
| Corinth: | 172.7 |
| Holly Springs: | 220.9 |
| Saltillo: | 171.9 |
| Pontotoc: | 260.7 |
| Tupelo: | 81.8 |
| Oxford: | 98.1 |
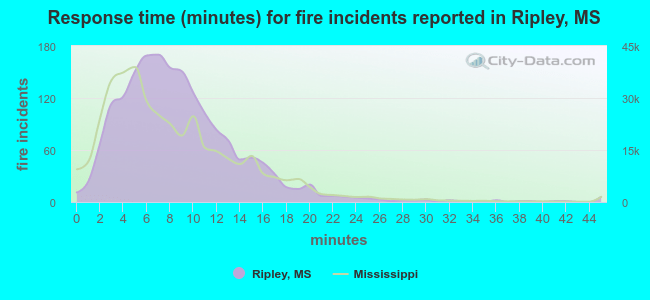 The median response time based on all reported fire incidents is 8 minutes. This is similar to the state median value.
The median response time in Ripley, MS compared to nearest cities:
(Note: Based on data for all years, including only cities with at least 500 fire incidents)
| Ripley: | 8 minutes |
| Ashland: | 10 minutes |
| Walnut: | 8 minutes |
| Myrtle: | 8 minutes |
| New Albany: | 7 minutes |
| Booneville: | 10 minutes |
| Blue Springs: | 9 minutes |
| Baldwyn: | 10 minutes |
| Rienzi: | 11 minutes |
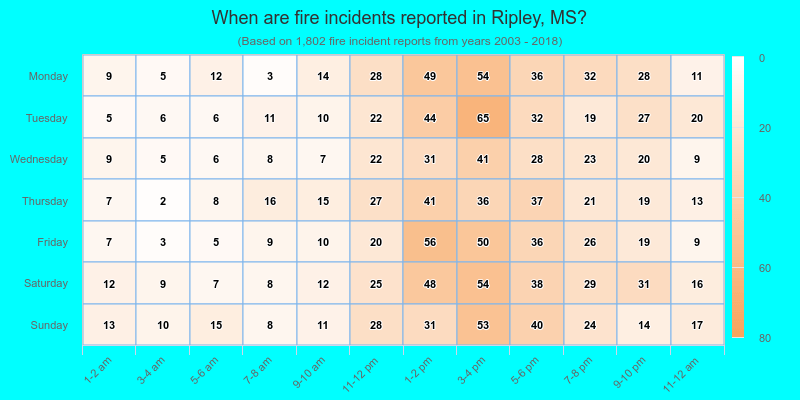
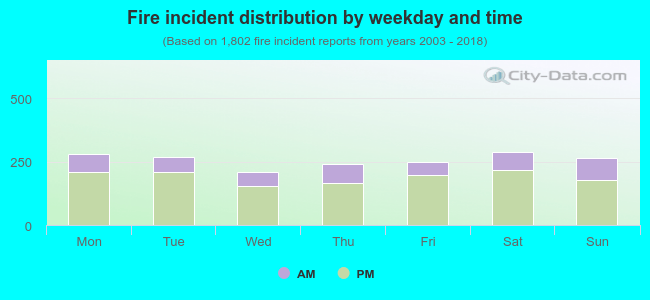 26.4% incidents where reported in the morning and 73.6% in the evening. The most fires (16.0%) took place on Saturday, and the least (11.6%) on Wednesday.
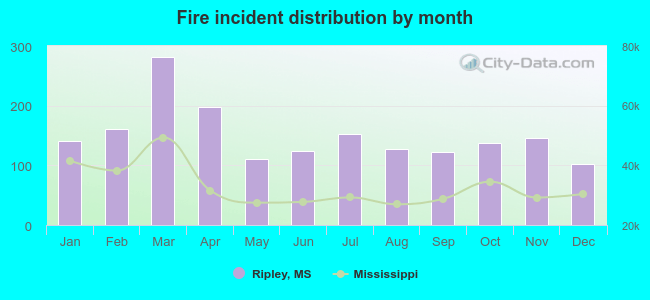 Based on the 1,802 fire incident reports from years 2003 - 2018 most fires (15.6%) took place during March, and the least (5.7%) in December.
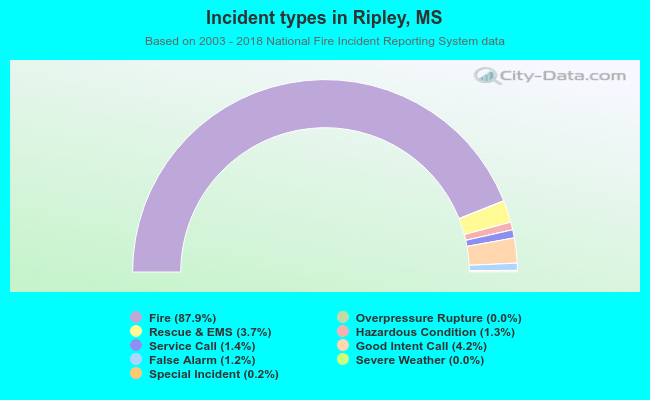 Out of all 2,049 cases reported during the years 2003 - 2018, the most belonged to the categories: Fire (87.9%), Good Intent Call (4.2%), and Rescue & EMS (3.7%).
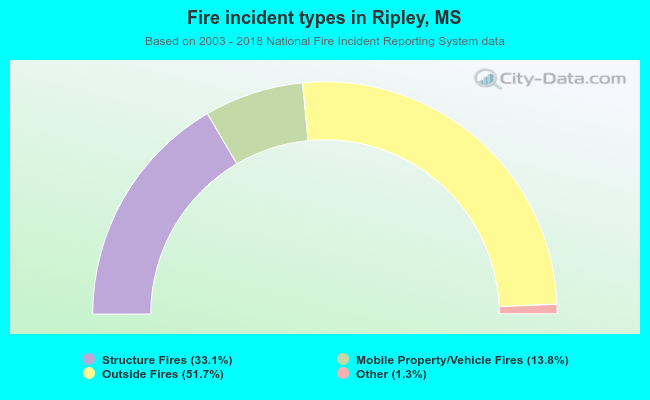 When looking into fire subcategories, the most incidents belonged to: Outside Fires (51.7%), and Structure Fires (33.1%).