Rowlett: Fire Incidents, Texas (TX)
Where are fire incidents reported in Rowlett, TX
Something went wrong! Please refresh the page.
| Fire incidents reported | |
|---|---|
| Sreet name | Count |
| LAKEVIEW PW | 112 |
| LAKEVIEW PKY | 106 |
| MILLER RD | 106 |
| DALROCK RD | 100 |
| ROWLETT RD | 90 |
| CHIESA RD | 74 |
| DEXHAM RD | 58 |
| MAIN ST | 52 |
| LIBERTY GROVE RD | 40 |
| LAKEVIEW PW PKY | 34 |
| IH 30 | 32 |
| MERRITT RD | 32 |
| CASTLE DR | 26 |
| PRESIDENT GEORGE BUSH HWY | 24 |
| SCENIC DR | 24 |
| ELM GROVE RD | 22 |
| HICKOX RD | 22 |
| LAKEVIEW | 22 |
| PRESIDENT GEORGE BUSH | 22 |
| PRINCETON RD | 20 |
| GARNER RD | 18 |
| HARBORVIEW BLVD | 18 |
| ROSEBUD DR | 18 |
| TOLER RD | 18 |
| C A ROAN DR | 16 |
| WESTOVER DR | 16 |
| CEDAR LN | 14 |
| COLUMBIA DR | 14 |
| GRISHAM DR | 14 |
| HARTFORD DR | 14 |
| Other | 641 |
2002 - 2018 National Fire Incident Reporting System (NFIRS) incidents
- Incident types reported to NFIRS in Rowlett, TX
- 17,14157.7%Rescue & EMS
- 3,48511.7%Service Call
- 3,25911.0%Hazardous Condition
- 2,2737.7%False Alarm
- 1,8196.1%Fire
- 1,1003.7%Good Intent Call
- 5341.8%Special Incident
- 620.2%Overpressure Rupture
- 310.1%Severe Weather
- Fire incident types reported to NFIRS in Rowlett, TX
- 82245.2%Outside Fires
- 60633.3%Structure Fires
- 28115.4%Mobile Property/Vehicle Fires
- 1106.0%Other
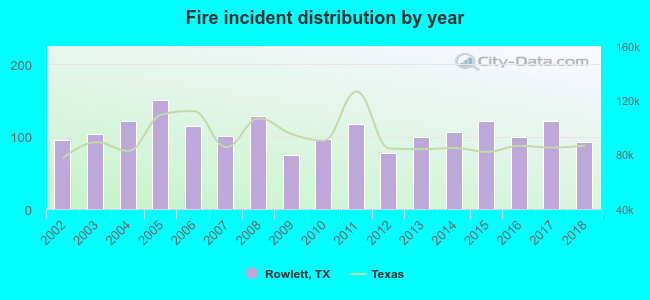 Based on the data from the years 2002 - 2018 the average number of fires per year is 107. The highest number of reported fire incidents - 150 took place in 2005, and the least - 75 in 2009. The data has a declining trend.
The average number of yearly fire incidents per 10k residents in Rowlett, TX compared to nearest cities:
(Note: Based on data for the last 3 years, including only cities with population 5,000 and above)
| Rowlett: | 17.9 |
| Garland: | 25.0 |
| Rockwall: | 23.0 |
| Sachse: | 16.6 |
| Heath: | 31.3 |
| Sunnyvale: | 56.1 |
| Wylie: | 21.6 |
| Murphy: | 16.6 |
| Mesquite: | 31.4 |
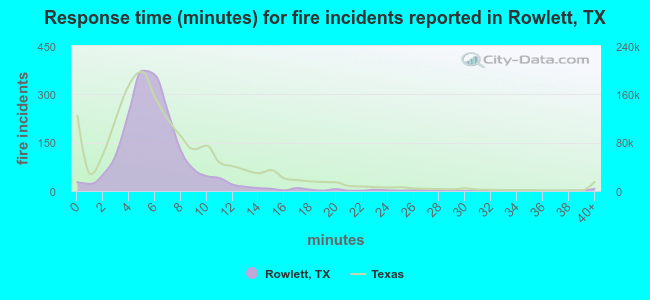 The median response time based on all reported fire incidents is 6 minutes. This is close to the state median value.
The median response time in Rowlett, TX compared to nearest cities:
(Note: Based on data for all years, including only cities with at least 500 fire incidents)
| Rowlett: | 6 minutes |
| Garland: | 5 minutes |
| Rockwall: | 5 minutes |
| Sachse: | 6 minutes |
| Wylie: | 6 minutes |
| Mesquite: | 5 minutes |
| Fate: | 8 minutes |
| Richardson: | 5 minutes |
| Forney: | 6 minutes |
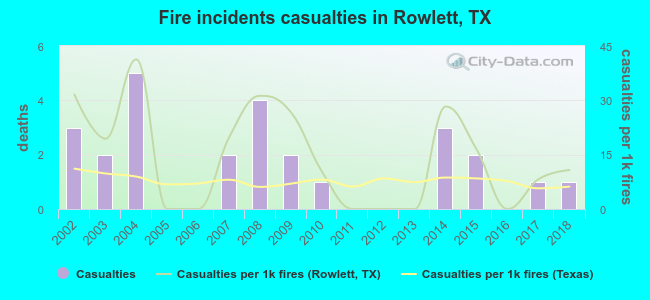 According to the data from the years 2002 - 2018 the average number of fire-related casualties per year is 2. The highest number of casualties - 5 took place in 2004, and the lowest - 0 in 2005. The data has a dropping trend.
The average number of injuries per 1,000 fires is 14. This indicator was the highest - 41 in 2004, and the lowest 0 in 2005. The trend for casualties per 1,000 fire incidents is dropping. Compared to the state value the number of casualties per 1,000 incidents is higher.
According to the data from the years 2002 - 2018 the average number of fire-related casualties per year is 2. The highest number of casualties - 5 took place in 2004, and the lowest - 0 in 2005. The data has a dropping trend.
The average number of injuries per 1,000 fires is 14. This indicator was the highest - 41 in 2004, and the lowest 0 in 2005. The trend for casualties per 1,000 fire incidents is dropping. Compared to the state value the number of casualties per 1,000 incidents is higher.
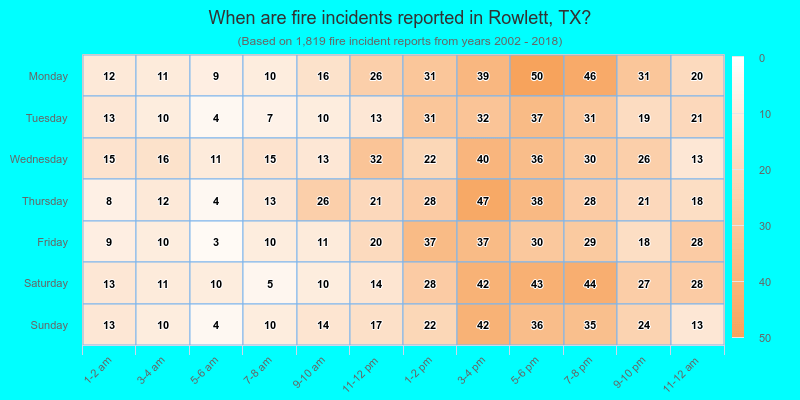
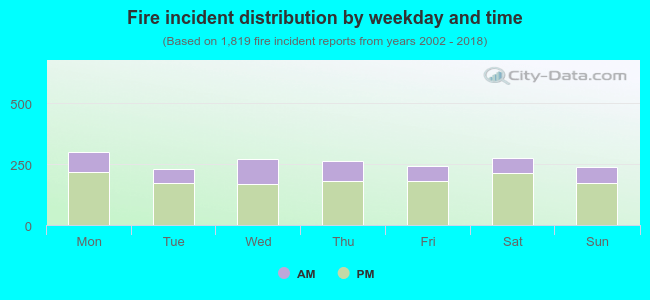 28.6% incidents where reported in the morning and 71.4% in the evening. The most fires (16.5%) took place on Monday, and the least (12.5%) on Tuesday.
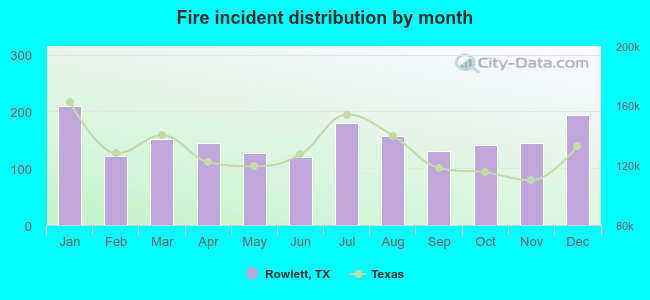 According to the 1,819 incident reports from years 2002 - 2018 most fires (11.5%) took place during January, and the least (6.6%) in June.
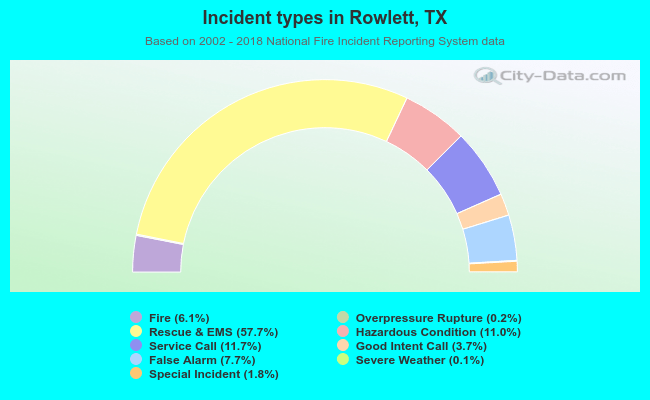 Out of all 29,704 cases reported during the years 2002 - 2018, the most belonged to the categories: Rescue & EMS (57.7%), Service Call (11.7%), and Hazardous Condition (11.0%).
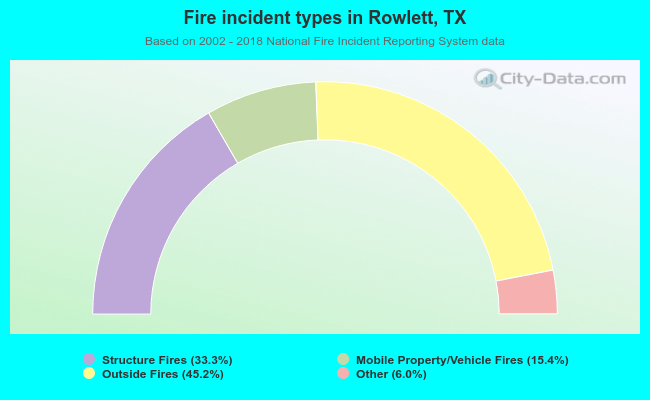 When looking into fire subcategories, the most incidents belonged to: Outside Fires (45.2%), and Structure Fires (33.3%).