Salem: Fire Incidents, Oregon (OR)
Where are fire incidents reported in Salem, OR
Something went wrong! Please refresh the page.
| Fire incidents reported | |
|---|---|
| Sreet name | Count |
| LANCASTER DR | 954 |
| COMMERCIAL ST | 560 |
| PORTLAND RD | 396 |
| STATE ST | 360 |
| CENTER ST | 308 |
| MARKET ST | 270 |
| HAWTHORNE AVE | 258 |
| MISSION ST | 248 |
| SUNNYVIEW RD | 222 |
| LIBERTY RD | 198 |
| WALLACE RD | 188 |
| BROADWAY ST | 186 |
| SILVERTON RD | 180 |
| RIVER RD | 174 |
| FRONT ST | 172 |
| LIBERTY ST | 172 |
| FISHER RD | 162 |
| TURNER RD | 150 |
| CHURCH ST | 134 |
| SUNNYSIDE RD | 116 |
| 12TH ST | 110 |
| 25TH ST | 110 |
| 14TH ST | 106 |
| EDGEWATER ST | 106 |
| BOONE RD | 104 |
| 13TH ST | 98 |
| CHEMEKETA ST | 94 |
| HOLLYWOOD DR | 88 |
| INTERSTATE 5 FWY | 88 |
| LEE ST | 88 |
| Other | 3,691 |
2002 - 2018 National Fire Incident Reporting System (NFIRS) incidents
- Incident types reported to NFIRS in Salem, OR
- 10,09141.9%Fire
- 9,09137.7%Rescue & EMS
- 1,7977.5%Service Call
- 1,5646.5%Good Intent Call
- 1,2485.2%Hazardous Condition
- 2861.2%False Alarm
- Fire incident types reported to NFIRS in Salem, OR
- 5,04049.9%Outside Fires
- 3,23032.0%Structure Fires
- 1,72217.1%Mobile Property/Vehicle Fires
- 991.0%Other
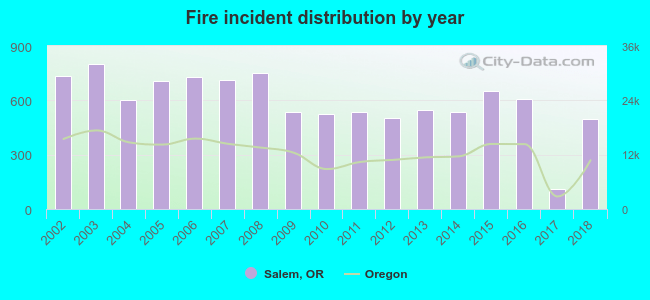 Based on the data from the years 2002 - 2018 the average number of fires per year is 594. The highest number of fire incidents - 803 took place in 2003, and the least - 112 in 2017. The data has a dropping trend.
The average number of yearly fire incidents per 10k residents in Salem, OR compared to nearest cities:
(Note: Based on data for the last 3 years, including only cities with population 5,000 and above)
| Salem: | 25.0 |
| Four Corners: | 1.9 |
| Keizer: | 8.4 |
| Independence: | 14.4 |
| Monmouth: | 14.7 |
| Silverton: | 22.1 |
| Dallas: | 26.9 |
| Stayton: | 34.4 |
| Woodburn: | 23.9 |
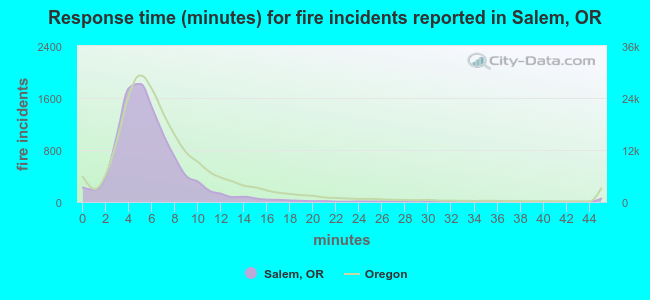 The median response time based on all reported fire incidents is 5 minutes. This is lower than the Oregon median value.
The median response time in Salem, OR compared to nearest cities:
(Note: Based on data for all years, including only cities with at least 500 fire incidents)
| Salem: | 5 minutes |
| Keizer: | 5 minutes |
| Turner: | 10 minutes |
| Silverton: | 8 minutes |
| Dallas: | 7 minutes |
| Stayton: | 8 minutes |
| Woodburn: | 7 minutes |
| Albany: | 6 minutes |
| McMinnville: | 6 minutes |
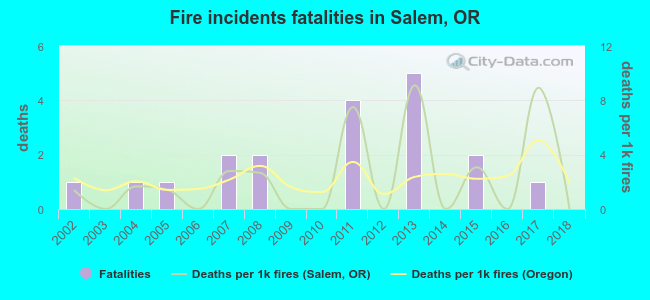 Based on the reports from the years 2002 - 2018 the average number of fire-related fatalities per year is 1. The highest number of reported deaths - 5 took place in 2013, and the lowest - 0 in 2003. The data has a dropping trend.
The average number of deaths per 1,000 fire incidents is 2. This indicator was the highest - 9 in 2013, and the lowest 0 in 2003. The trend for fatalities per 1,000 fires is decreasing. Compared to the Oregon value the number of deaths per 1,000 fire incidents is about the same.
Based on the reports from the years 2002 - 2018 the average number of fire-related fatalities per year is 1. The highest number of reported deaths - 5 took place in 2013, and the lowest - 0 in 2003. The data has a dropping trend.
The average number of deaths per 1,000 fire incidents is 2. This indicator was the highest - 9 in 2013, and the lowest 0 in 2003. The trend for fatalities per 1,000 fires is decreasing. Compared to the Oregon value the number of deaths per 1,000 fire incidents is about the same.Deaths per 1,000 incidents in Salem, OR compared to nearest cities:
(Note: Based on data for all years, including only cities with at least 2,500 fire incidents)
| Salem: | 1.9 |
| Albany: | 2.2 |
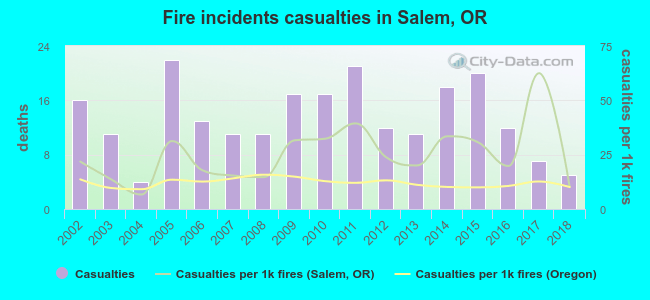 Based on the data from the years 2002 - 2018 the average number of fire-related yearly casualties is 13. The highest number of reported casualties - 22 took place in 2005, and the lowest - 4 in 2004. The data has a dropping trend.
The average number of casualties per 1,000 fire incidents is 25. This indicator was the highest - 63 in 2017, and the lowest 7 in 2004. The trend for casualties per 1,000 incidents is decreasing. Compared to the Oregon value the number of casualties per 1,000 fires is higher.
Based on the data from the years 2002 - 2018 the average number of fire-related yearly casualties is 13. The highest number of reported casualties - 22 took place in 2005, and the lowest - 4 in 2004. The data has a dropping trend.
The average number of casualties per 1,000 fire incidents is 25. This indicator was the highest - 63 in 2017, and the lowest 7 in 2004. The trend for casualties per 1,000 incidents is decreasing. Compared to the Oregon value the number of casualties per 1,000 fires is higher.
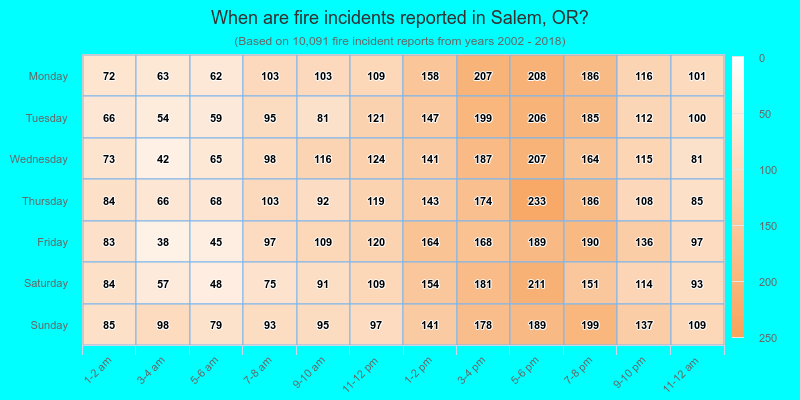
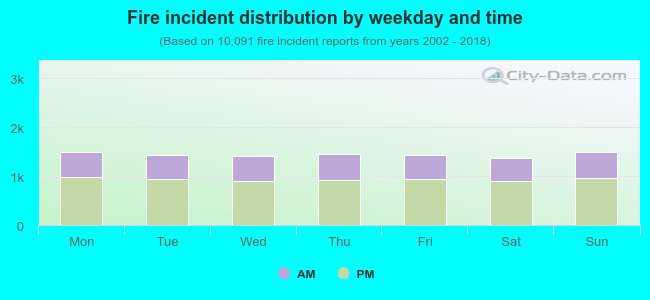 35.1% incidents where reported in the morning and 64.9% in the evening. The most fires (14.9%) took place on Sunday, and the least (13.6%) on Saturday.
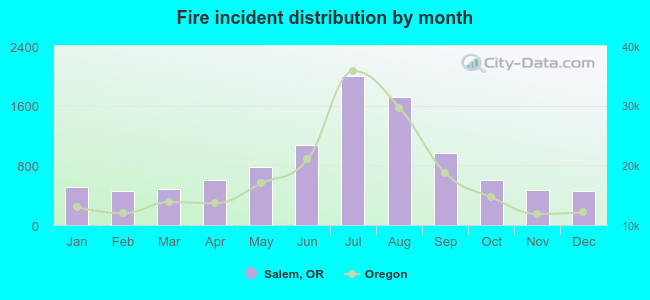 According to the 10,091 fire incidents from years 2002 - 2018 most fires (19.8%) took place during July, and the least (4.5%) in December.
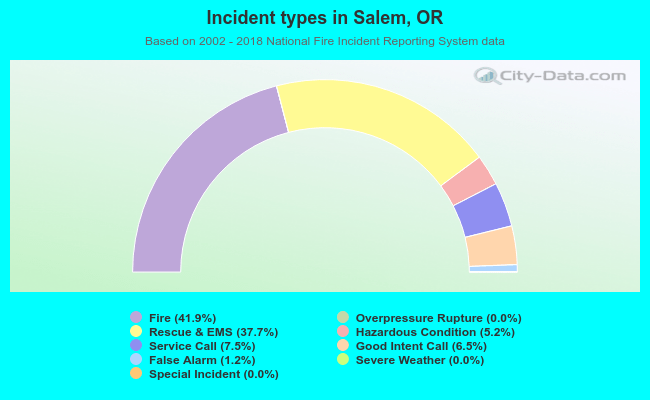 Out of all 24,083 cases reported during the years 2002 - 2018, the most belonged to the categories: Fire (41.9%), Rescue & EMS (37.7%), and Service Call (7.5%).
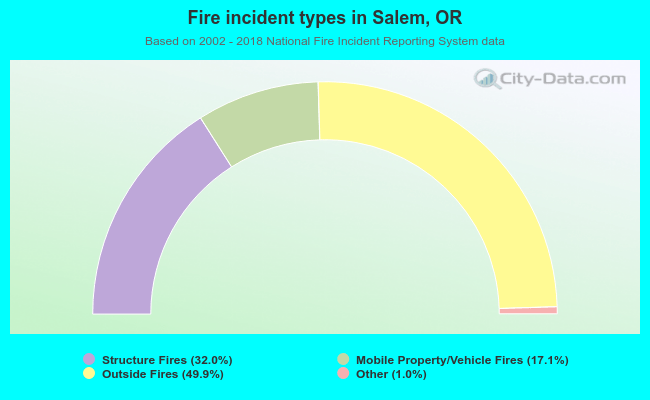 When looking into fire subcategories, the most incidents belonged to: Outside Fires (49.9%), and Structure Fires (32.0%).