San Angelo: Fire Incidents, Texas (TX)
Where are fire incidents reported in San Angelo, TX
Something went wrong! Please refresh the page.
| Fire incidents reported | |
|---|---|
| Sreet name | Count |
| KNICKERBOCKER RD | 204 |
| CHADBOURNE ST | 192 |
| SUNSET DR | 120 |
| GRAPE CREEK RD | 100 |
| US 87 HWY | 88 |
| SHERWOOD WAY | 78 |
| US HWY 87 | 78 |
| JACKSON ST | 74 |
| PULLIAM ST | 74 |
| KNICKERBOCKER R | 68 |
| BELL ST | 66 |
| SHERWOOD W | 64 |
| BRYANT BL | 60 |
| CHRISTOVAL RD | 60 |
| BEN FICKLIN RD | 58 |
| SHERWOOD WAY | 58 |
| SUNSET D | 58 |
| BEAUREGARD AVE | 52 |
| 14TH ST | 50 |
| 19TH ST | 50 |
| 29TH ST | 50 |
| LILLIE ST | 50 |
| ARMSTRONG ST | 48 |
| HARRIS AV | 48 |
| N CHADBOURNE S | 48 |
| PREUSSER ST | 48 |
| OAKES ST | 46 |
| BRYANT BLVD | 44 |
| 23RD ST | 42 |
| FM 2288 | 42 |
| Other | 4,477 |
2002 - 2018 National Fire Incident Reporting System (NFIRS) incidents
- Incident types reported to NFIRS in San Angelo, TX
- 45,69371.3%Rescue & EMS
- 6,59510.3%Fire
- 4,2216.6%Hazardous Condition
- 3,2875.1%False Alarm
- 2,4343.8%Service Call
- 1,7432.7%Good Intent Call
- Fire incident types reported to NFIRS in San Angelo, TX
- 3,14947.7%Outside Fires
- 2,24534.0%Structure Fires
- 87713.3%Mobile Property/Vehicle Fires
- 3244.9%Other
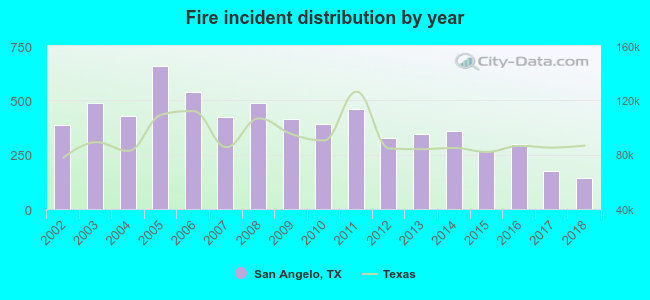 According to the data from the years 2002 - 2018 the average number of fires per year is 388. The highest number of fire incidents - 659 took place in 2005, and the least - 142 in 2018. The data has a dropping trend.
The average number of yearly fire incidents per 10k residents in San Angelo, TX compared to nearest cities:
(Note: Based on data for the last 3 years, including only cities with population 5,000 and above)
| San Angelo: | 20.7 |
| Brady: | 111.2 |
| Sweetwater: | 113.2 |
| Abilene: | 41.0 |
| Big Spring: | 67.3 |
| Brownwood: | 74.8 |
| Snyder: | 47.5 |
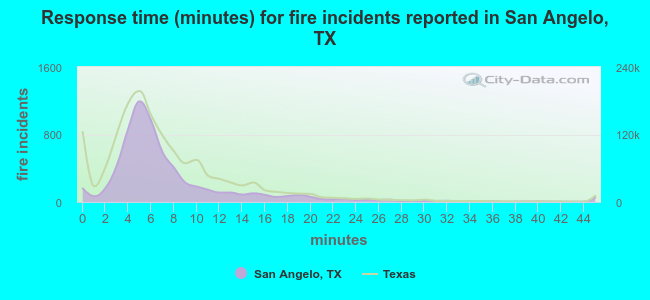 The median response time based on all reported fire incidents is 6 minutes. This is similar to the state median value.
The median response time in San Angelo, TX compared to nearest cities:
(Note: Based on data for all years, including only cities with at least 500 fire incidents)
| San Angelo: | 6 minutes |
| Ballinger: | 8 minutes |
| Sonora: | 17 minutes |
| Coleman: | 9 minutes |
| Brady: | 7 minutes |
| Colorado City: | 6 minutes |
| Sweetwater: | 4 minutes |
| Bangs: | 9 minutes |
| Abilene: | 5 minutes |
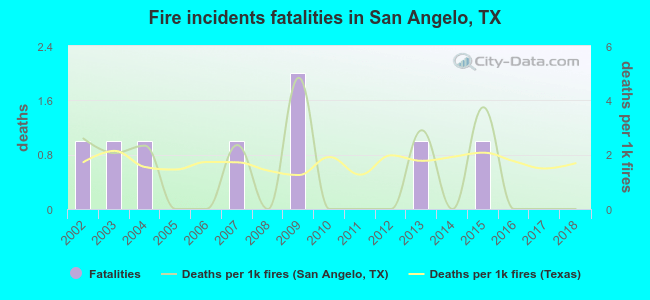 According to the data from the years 2002 - 2018 the average number of fire-related fatalities per year is 0. The highest number of deaths - 2 took place in 2009, and the lowest - 0 in 2005. The data has a decreasing trend.
The average number of fatalities per 1,000 fire incidents is 1. This indicator was the highest - 5 in 2009, and the lowest 0 in 2005. The trend for fatalities per 1,000 incidents is declining. Compared to the state value the number of deaths per 1,000 fire incidents is lower.
According to the data from the years 2002 - 2018 the average number of fire-related fatalities per year is 0. The highest number of deaths - 2 took place in 2009, and the lowest - 0 in 2005. The data has a decreasing trend.
The average number of fatalities per 1,000 fire incidents is 1. This indicator was the highest - 5 in 2009, and the lowest 0 in 2005. The trend for fatalities per 1,000 incidents is declining. Compared to the state value the number of deaths per 1,000 fire incidents is lower.Deaths per 1,000 incidents in San Angelo, TX compared to nearest cities:
(Note: Based on data for all years, including only cities with at least 2,500 fire incidents)
| San Angelo: | 1.2 |
| Abilene: | 2.8 |
| Big Spring: | 0.7 |
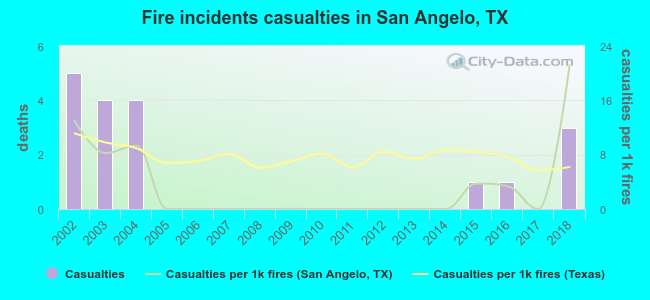 According to the reports from the years 2002 - 2018 the average number of fire-related casualties per year is 1. The highest number of reported casualties - 5 took place in 2002, and the lowest - 0 in 2005. The data has a dropping trend.
The average number of casualties per 1,000 fires is 3. This indicator was the highest - 21 in 2018, and the lowest 0 in 2005. The trend for injuries per 1,000 incidents is increasing. Compared to the state value the number of injuries per 1,000 incidents is much lower.
According to the reports from the years 2002 - 2018 the average number of fire-related casualties per year is 1. The highest number of reported casualties - 5 took place in 2002, and the lowest - 0 in 2005. The data has a dropping trend.
The average number of casualties per 1,000 fires is 3. This indicator was the highest - 21 in 2018, and the lowest 0 in 2005. The trend for injuries per 1,000 incidents is increasing. Compared to the state value the number of injuries per 1,000 incidents is much lower.Casualties per 1,000 incidents in San Angelo, TX compared to nearest cities:
(Note: Based on data for all years, including only cities with at least 500 fire incidents)
| San Angelo: | 2.7 |
| Ballinger: | 3.3 |
| Sonora: | 1.7 |
| Coleman: | 2.1 |
| Brady: | 1.9 |
| Colorado City: | 0.0 |
| Sweetwater: | 0.6 |
| Bangs: | 0.0 |
| Abilene: | 19.9 |
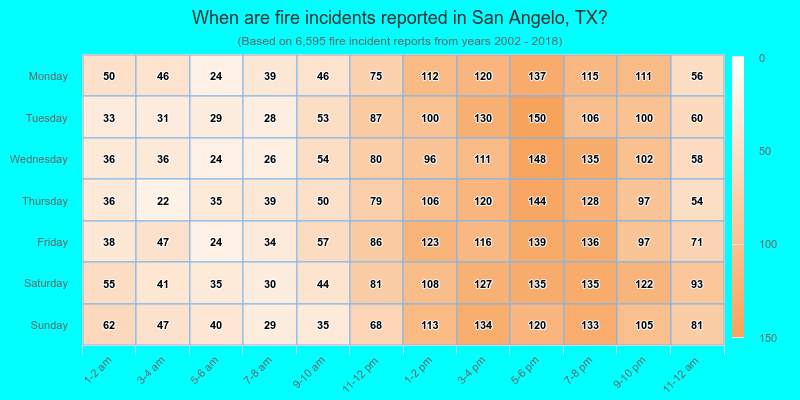
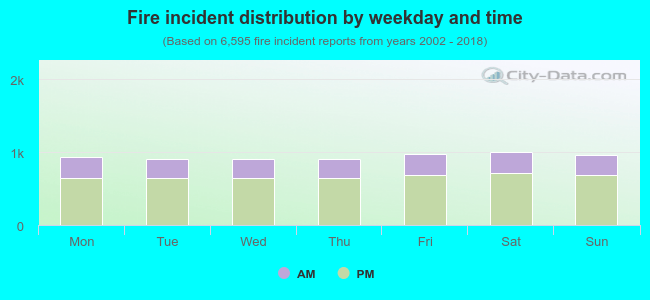 29.0% incidents where reported in the morning and 71.0% in the evening. The most fires (15.3%) took place on Saturday, and the least (13.7%) on Wednesday.
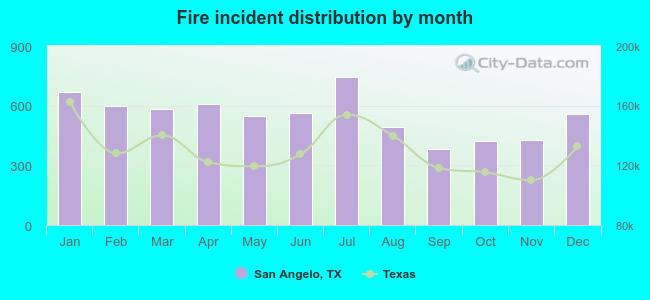 According to the 6,595 reports from years 2002 - 2018 most fires (11.3%) took place during July, and the least (5.8%) in September.
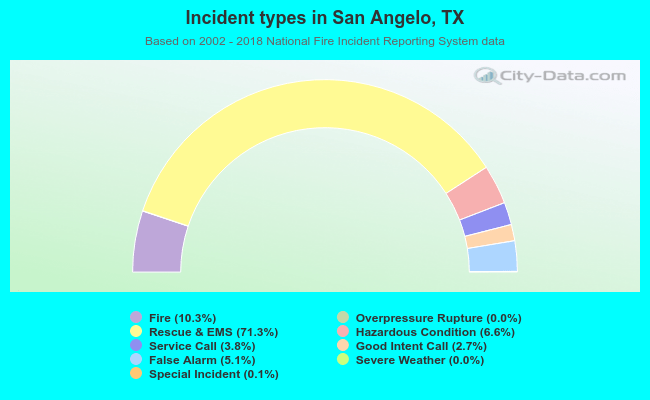 Out of all 64,046 cases reported during the years 2002 - 2018, the most belonged to the categories: Rescue & EMS (71.3%), Fire (10.3%), and Hazardous Condition (6.6%).
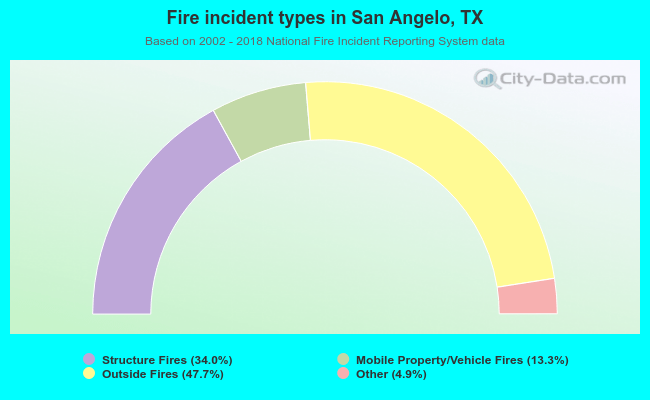 When looking into fire subcategories, the most incidents belonged to: Outside Fires (47.7%), and Structure Fires (34.0%).