San Francisco: Fire Incidents, California (CA)
Where are fire incidents reported in San Francisco, CA
Something went wrong! Please refresh the page.
| Fire incidents reported | |
|---|---|
| Sreet name | Count |
| MISSION ST | 482 |
| MARKET ST | 456 |
| EDDY ST | 314 |
| TURK ST | 294 |
| ELLIS ST | 216 |
| OFARRELL ST | 206 |
| VAN NESS AVE | 202 |
| CALIFORNIA ST | 192 |
| GOLDEN GATE AVE | 192 |
| 6TH ST | 188 |
| MCALLISTER ST | 166 |
| SUTTER ST | 158 |
| POST ST | 148 |
| 3RD ST | 142 |
| HOWARD ST | 136 |
| VALENCIA ST | 136 |
| FOLSOM ST | 132 |
| PINE ST | 132 |
| FILLMORE ST | 112 |
| GEARY BL | 112 |
| BUSH ST | 110 |
| CLAY ST | 110 |
| JONES ST | 108 |
| POTRERO AVE | 108 |
| SANCHEZ ST | 106 |
| GEARY ST | 104 |
| BROADWAY | 102 |
| POWELL ST | 102 |
| FULTON ST | 100 |
| 16TH ST | 98 |
| Other | 9,104 |
2014 - 2018 National Fire Incident Reporting System (NFIRS) incidents
- Incident types reported to NFIRS in San Francisco, CA
- 44,77742.7%False Alarm
- 16,80616.0%Rescue & EMS
- 15,41414.7%Service Call
- 14,26813.6%Fire
- 6,8046.5%Hazardous Condition
- 5,4945.2%Good Intent Call
- 9030.9%Special Incident
- 3670.3%Overpressure Rupture
- Fire incident types reported to NFIRS in San Francisco, CA
- 6,33744.4%Outside Fires
- 5,82040.8%Structure Fires
- 1,1428.0%Other
- 9696.8%Mobile Property/Vehicle Fires
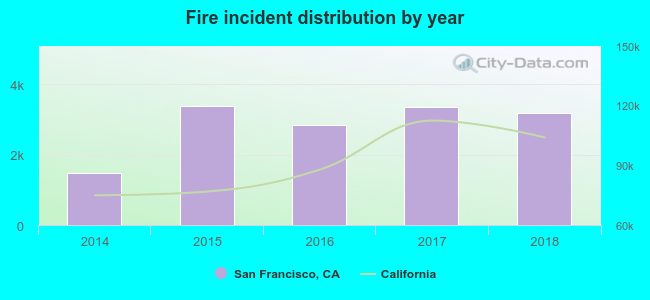 Based on the data from the years 2014 - 2018 the average number of fire incidents per year is 2,842. The highest number of fire incidents - 3,388 took place in 2015, and the least - 1,471 in 2014. The data has a growing trend.
The average number of yearly fire incidents per 10k residents in San Francisco, CA compared to nearest cities:
(Note: Based on data for the last 3 years, including only cities with population 5,000 and above)
| San Francisco: | 36.6 |
| Daly City: | 14.1 |
| South San Francisco: | 19.8 |
| Sausalito: | 79.4 |
| Tiburon: | 19.9 |
| San Bruno: | 22.9 |
| Emeryville: | 46.3 |
| Pacifica: | 20.9 |
| Alameda: | 20.8 |
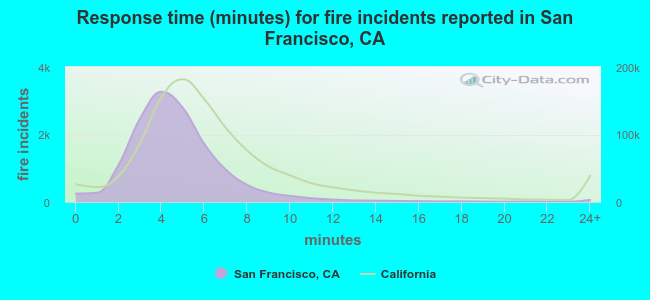 The median response time based on all reported fire incidents is 4 minutes. This is lower compared to the state median value.
The median response time in San Francisco, CA compared to nearest cities:
(Note: Based on data for all years, including only cities with at least 500 fire incidents)
| San Francisco: | 4 minutes |
| Daly City: | 4 minutes |
| Brisbane: | 5 minutes |
| South San Francisco: | 4 minutes |
| Sausalito: | 6 minutes |
| San Bruno: | 4 minutes |
| Pacifica: | 5 minutes |
| Alameda: | 4 minutes |
| Millbrae: | 4 minutes |
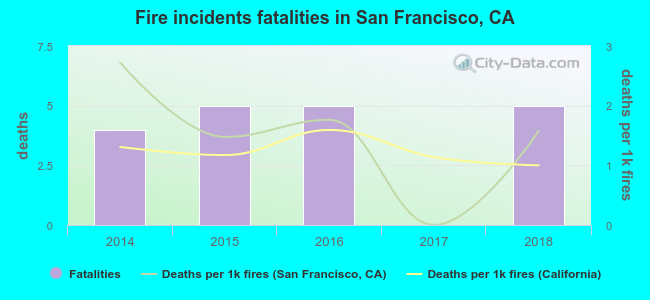 According to the data from the years 2014 - 2018 the average number of fire-related yearly deaths is 4. The highest number of deaths - 5 took place in 2015, and the lowest - 0 in 2017. The data has an increasing trend.
The average number of fatalities per 1,000 fire incidents is 2. This indicator was the highest - 3 in 2014, and the lowest 0 in 2017. The trend for fatalities per 1,000 fire incidents is decreasing. Compared to the state value the number of fatalities per 1,000 incidents is similar.
According to the data from the years 2014 - 2018 the average number of fire-related yearly deaths is 4. The highest number of deaths - 5 took place in 2015, and the lowest - 0 in 2017. The data has an increasing trend.
The average number of fatalities per 1,000 fire incidents is 2. This indicator was the highest - 3 in 2014, and the lowest 0 in 2017. The trend for fatalities per 1,000 fire incidents is decreasing. Compared to the state value the number of fatalities per 1,000 incidents is similar.Deaths per 1,000 incidents in San Francisco, CA compared to nearest cities:
(Note: Based on data for all years, including only cities with at least 2,500 fire incidents)
| San Francisco: | 1.3 |
| Oakland: | 4.7 |
| Berkeley: | 2.0 |
| Richmond: | 1.9 |
| San Mateo: | 0.7 |
| San Leandro: | 2.4 |
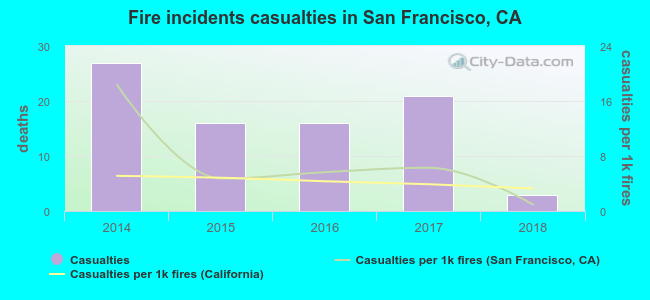 According to the data from the years 2014 - 2018 the average number of fire-related yearly casualties is 17. The highest number of casualties - 27 took place in 2014, and the lowest - 3 in 2018. The data has a declining trend.
The average number of injuries per 1,000 fires is 7. This indicator was the highest - 18 in 2014, and the lowest 1 in 2018. The trend for injuries per 1,000 incidents is decreasing. Compared to the state value the number of injuries per 1,000 fires is similar.
According to the data from the years 2014 - 2018 the average number of fire-related yearly casualties is 17. The highest number of casualties - 27 took place in 2014, and the lowest - 3 in 2018. The data has a declining trend.
The average number of injuries per 1,000 fires is 7. This indicator was the highest - 18 in 2014, and the lowest 1 in 2018. The trend for injuries per 1,000 incidents is decreasing. Compared to the state value the number of injuries per 1,000 fires is similar.
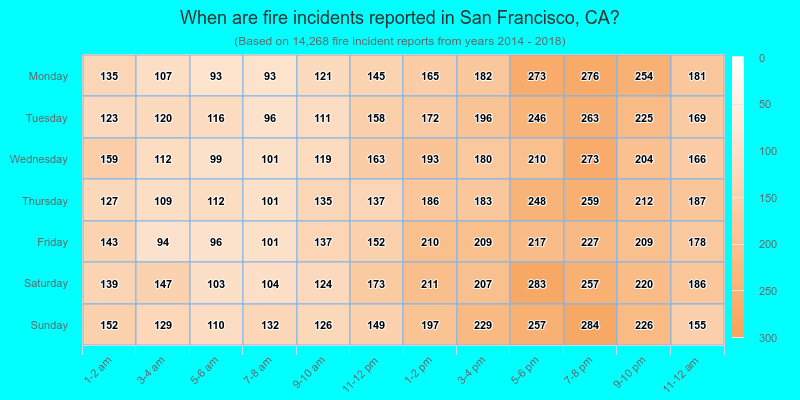
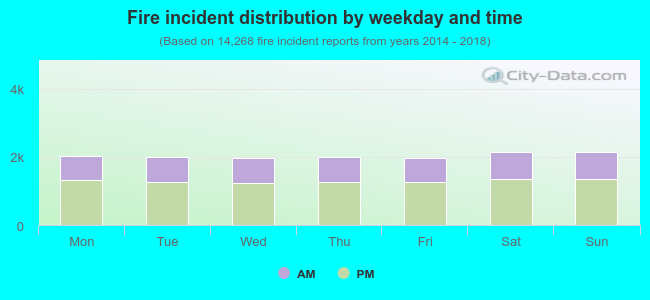 36.5% incidents where reported in the morning and 63.5% in the evening. The most fires (15.1%) took place on Saturday, and the least (13.8%) on Friday.
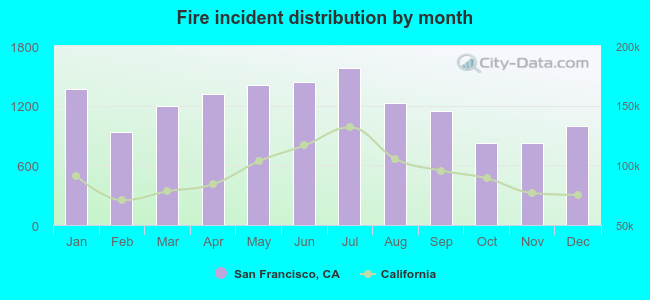 According to the 14,268 fire incidents from years 2014 - 2018 most fires (11.1%) took place during July, and the least (5.8%) in November.
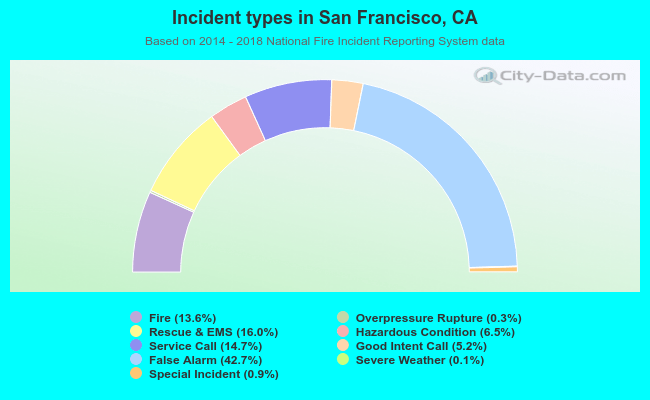 Out of all 104,917 cases reported during the years 2014 - 2018, the most belonged to the categories: False Alarm (42.7%), Rescue & EMS (16.0%), and Service Call (14.7%).
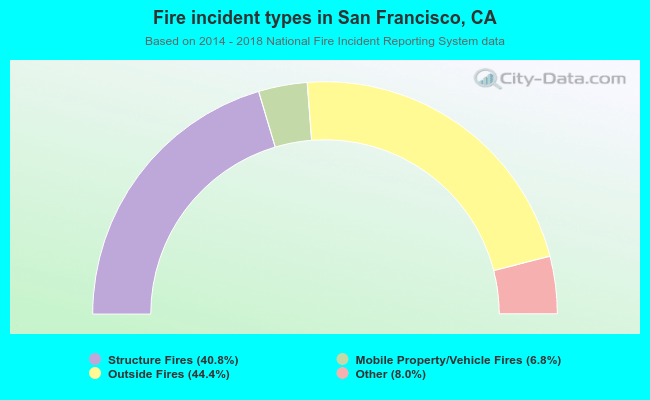 When looking into fire subcategories, the most incidents belonged to: Outside Fires (44.4%), and Structure Fires (40.8%).