Sanford: Fire Incidents, Florida (FL)
Where are fire incidents reported in Sanford, FL
Something went wrong! Please refresh the page.
| Fire incidents reported | |
|---|---|
| Sreet name | Count |
| US 17 92 | 128 |
| ORLANDO DR | 120 |
| SANFORD AVE | 104 |
| ORLANDO DR | 94 |
| SR 46 | 94 |
| N US 17 92 | 84 |
| OLD ENGLAND LOOP | 84 |
| W SR 46 | 84 |
| SANFORD AVE | 78 |
| W 5TH ST | 76 |
| S SR 417 | 72 |
| W AIRPORT BLVD | 72 |
| WILLNER CIR | 58 |
| US HWY 1792 | 50 |
| FRENCH AVE | 48 |
| MELLONVILLE AVE | 46 |
| PARK AVE | 46 |
| ST JOHNS PKWY | 44 |
| AIRPORT BLVD | 42 |
| PALMETTO AVE | 42 |
| RIDGEWOOD AVE | 42 |
| ROSEBERRY LN | 42 |
| FRENCH AVE | 40 |
| PALMETTO AVE | 40 |
| BUSH BLVD | 38 |
| HARTWELL AVE | 38 |
| NW US 17 92 | 38 |
| ORANGE BLVD | 36 |
| RIDGEWOOD AVE | 36 |
| RINEHART RD | 36 |
| Other | 3,762 |
2003 - 2018 National Fire Incident Reporting System (NFIRS) incidents
- Incident types reported to NFIRS in Sanford, FL
- 43,32463.8%Rescue & EMS
- 7,07910.4%Good Intent Call
- 5,6148.3%Fire
- 5,2397.7%Hazardous Condition
- 3,2314.8%False Alarm
- 3,0084.4%Service Call
- 3360.5%Special Incident
- Fire incident types reported to NFIRS in Sanford, FL
- 2,39542.7%Outside Fires
- 1,94034.6%Structure Fires
- 1,00818.0%Mobile Property/Vehicle Fires
- 2714.8%Other
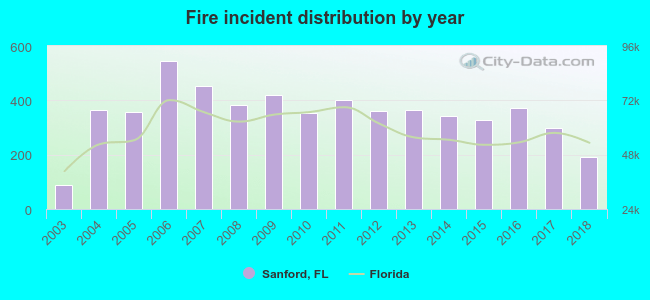 According to the data from the years 2003 - 2018 the average number of fire incidents per year is 351. The highest number of reported fire incidents - 543 took place in 2006, and the least - 88 in 2003. The data has an increasing trend.
The average number of yearly fire incidents per 10k residents in Sanford, FL compared to nearest cities:
(Note: Based on data for the last 3 years, including only cities with population 5,000 and above)
| Sanford: | 49.8 |
| Lake Mary: | 18.4 |
| Winter Springs: | 11.3 |
| Longwood: | 38.7 |
| Deltona: | 25.0 |
| Casselberry: | 16.5 |
| Orange City: | 114.3 |
| Oviedo: | 19.3 |
| Fern Park: | 13.8 |
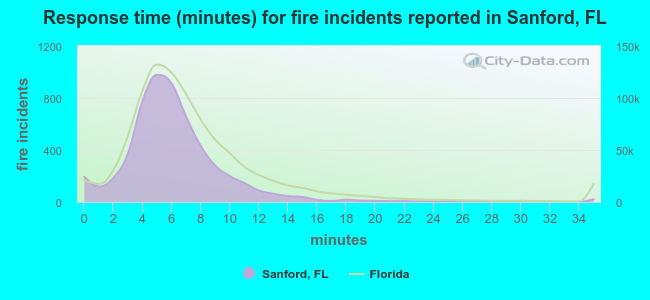 The median response time based on all reported fire incidents is 6 minutes. This is similar to the state median value.
The median response time in Sanford, FL compared to nearest cities:
(Note: Based on data for all years, including only cities with at least 500 fire incidents)
| Sanford: | 6 minutes |
| Lake Mary: | 6 minutes |
| Winter Springs: | 5 minutes |
| Longwood: | 5 minutes |
| Deltona: | 6 minutes |
| Casselberry: | 5 minutes |
| Orange City: | 5 minutes |
| Geneva: | 8 minutes |
| Oviedo: | 6 minutes |
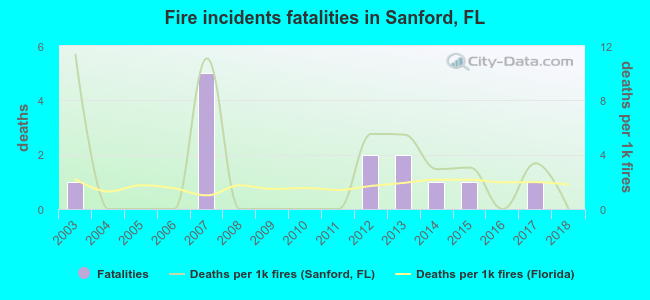 According to the data from the years 2003 - 2018 the average number of fire-related fatalities per year is 1. The highest number of deaths - 5 took place in 2007, and the lowest - 0 in 2004. The data has a dropping trend.
The average number of deaths per 1,000 fires is 3. This indicator was the highest - 11 in 2003, and the lowest 0 in 2004. The trend for deaths per 1,000 fire incidents is dropping. Compared to the Florida value the number of fatalities per 1,000 fires is higher.
According to the data from the years 2003 - 2018 the average number of fire-related fatalities per year is 1. The highest number of deaths - 5 took place in 2007, and the lowest - 0 in 2004. The data has a dropping trend.
The average number of deaths per 1,000 fires is 3. This indicator was the highest - 11 in 2003, and the lowest 0 in 2004. The trend for deaths per 1,000 fire incidents is dropping. Compared to the Florida value the number of fatalities per 1,000 fires is higher.
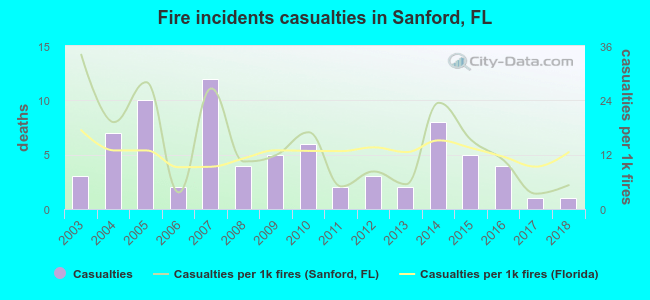 According to the reports from the years 2003 - 2018 the average number of fire-related yearly casualties is 5. The highest number of reported injuries - 12 took place in 2007, and the lowest - 1 in 2017. The data has a declining trend.
The average number of injuries per 1,000 fires is 14. This indicator was the highest - 34 in 2003, and the lowest 3 in 2017. The trend for injuries per 1,000 incidents is declining. Compared to the Florida value the number of casualties per 1,000 fire incidents is similar.
According to the reports from the years 2003 - 2018 the average number of fire-related yearly casualties is 5. The highest number of reported injuries - 12 took place in 2007, and the lowest - 1 in 2017. The data has a declining trend.
The average number of injuries per 1,000 fires is 14. This indicator was the highest - 34 in 2003, and the lowest 3 in 2017. The trend for injuries per 1,000 incidents is declining. Compared to the Florida value the number of casualties per 1,000 fire incidents is similar.Casualties per 1,000 incidents in Sanford, FL compared to nearest cities:
(Note: Based on data for all years, including only cities with at least 500 fire incidents)
| Sanford: | 13.4 |
| Lake Mary: | 20.7 |
| Winter Springs: | 36.7 |
| Longwood: | 29.7 |
| Deltona: | 33.1 |
| Casselberry: | 20.4 |
| Orange City: | 11.2 |
| Geneva: | 20.3 |
| Oviedo: | 28.8 |
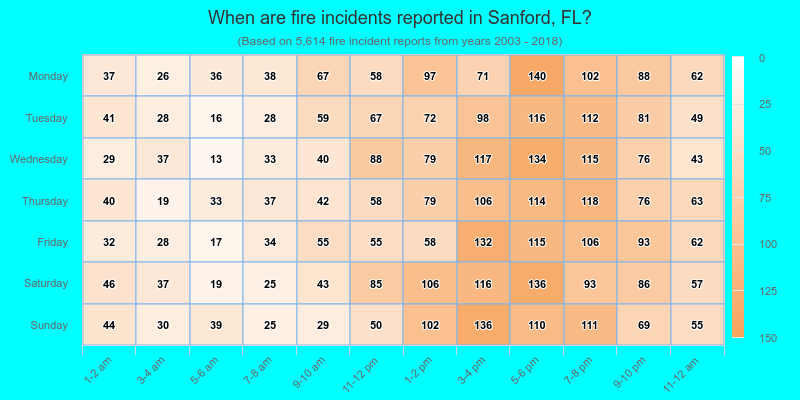
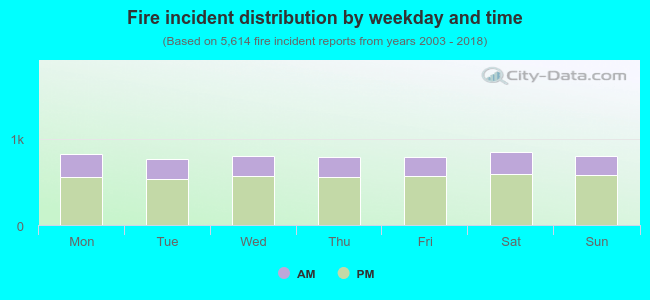 29.6% incidents where reported in the morning and 70.4% in the evening. The most fires (15.1%) took place on Saturday, and the least (13.7%) on Tuesday.
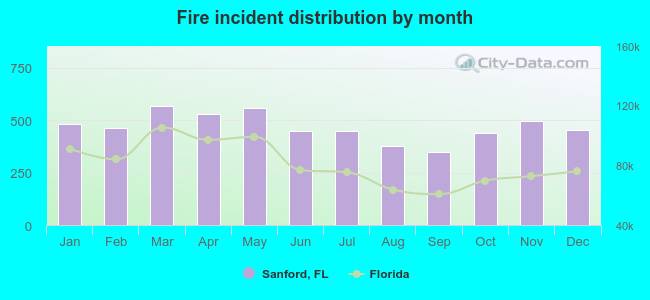 According to the 5,614 fires from years 2003 - 2018 most fires (10.1%) took place during March, and the least (6.2%) in September.
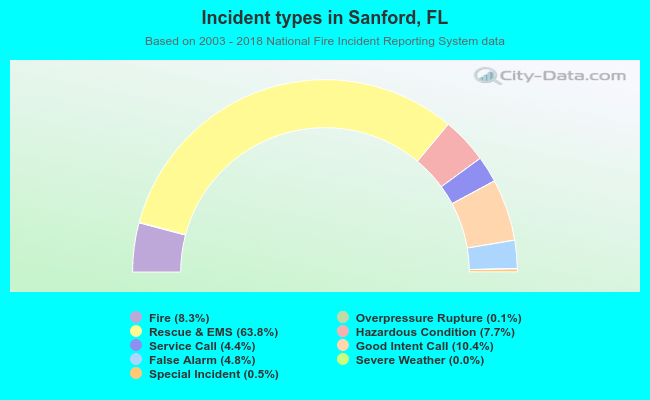 Out of all 67,885 cases reported during the years 2003 - 2018, the most belonged to the categories: Rescue & EMS (63.8%), Good Intent Call (10.4%), and Fire (8.3%).
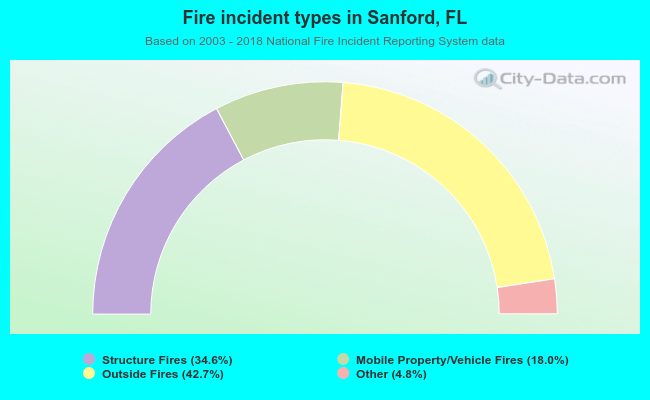 When looking into fire subcategories, the most reports belonged to: Outside Fires (42.7%), and Structure Fires (34.6%).