Santa Fe Springs: Fire Incidents, California (CA)
Where are fire incidents reported in Santa Fe Springs, CA
Something went wrong! Please refresh the page.
| Fire incidents reported | |
|---|---|
| Sreet name | Count |
| PIONEER BLVD | 126 |
| TELEGRAPH RD | 112 |
| NORWALK BLVD | 68 |
| CARMENITA RD | 62 |
| 605 SAN GABRIEL RIVER | 46 |
| WASHINGTON BLVD | 46 |
| MARQUARDT AV | 44 |
| LOS NIETOS RD | 36 |
| 605 SAN GABRIEL RIVER FRWY | 30 |
| ORR AND DAY RD | 28 |
| FLORENCE AV | 26 |
| IMPERIAL HWY | 26 |
| SHOEMAKER AV | 26 |
| 605 - SAN GABRIEL RIVER FRWY | 24 |
| 5 - SANTA ANA FRWY | 22 |
| BURKE ST | 22 |
| ROSECRANS | 22 |
| 5 SANTA ANA | 18 |
| 5 SANTA ANA FRWY | 18 |
| BLOOMFIELD AV | 18 |
| DICE RD | 18 |
| GREENSTONE | 18 |
| GREENSTONE AV | 18 |
| MARQUARDT | 18 |
| SORENSEN | 18 |
| ALONDRA BLVD | 16 |
| CEDARDALE DR | 16 |
| LAKELAND RD | 16 |
| ROSECRANS AV | 16 |
| SLAUSON AV | 16 |
2005 - 2018 National Fire Incident Reporting System (NFIRS) incidents
- Incident types reported to NFIRS in Santa Fe Springs, CA
- 6,64555.6%Rescue & EMS
- 2,29719.2%Good Intent Call
- 8957.5%False Alarm
- 8677.3%Fire
- 6455.4%Hazardous Condition
- 5404.5%Service Call
- 440.4%Special Incident
- 150.1%Overpressure Rupture
- Fire incident types reported to NFIRS in Santa Fe Springs, CA
- 41648.0%Outside Fires
- 22926.4%Mobile Property/Vehicle Fires
- 16218.7%Structure Fires
- 606.9%Other
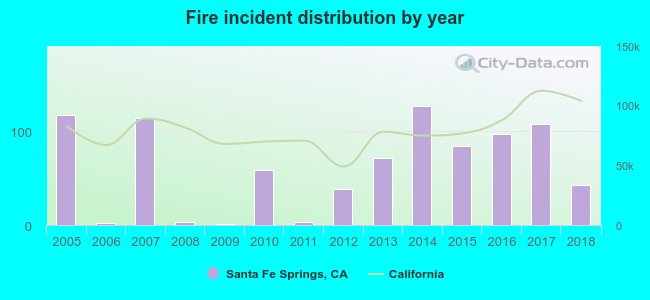 Based on the data from the years 2005 - 2018 the average number of fire incidents per year is 62. The highest number of reported fire incidents - 127 took place in 2014, and the least - 1 in 2009. The data has a dropping trend.
The average number of yearly fire incidents per 10k residents in Santa Fe Springs, CA compared to nearest cities:
(Note: Based on data for the last 3 years, including only cities with population 5,000 and above)
| Santa Fe Springs: | 47.1 |
| Norwalk: | 12.2 |
| Whittier: | 11.9 |
| Downey: | 13.6 |
| Pico Rivera: | 15.8 |
| La Mirada: | 7.6 |
| Cerritos: | 14.6 |
| Bellflower: | 19.1 |
| Artesia: | 14.4 |
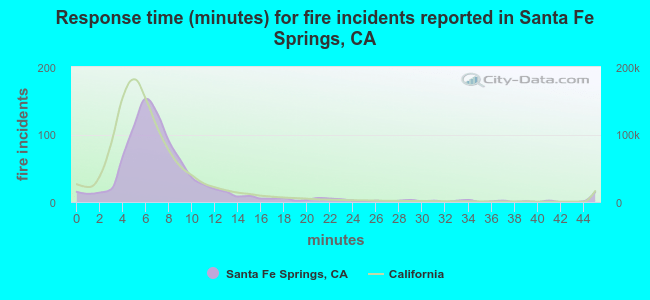 The median response time based on all reported fire incidents is 7 minutes. This is similar to the California median value.
The median response time in Santa Fe Springs, CA compared to nearest cities:
(Note: Based on data for all years, including only cities with at least 500 fire incidents)
| Santa Fe Springs: | 7 minutes |
| Norwalk: | 5 minutes |
| Whittier: | 4 minutes |
| Downey: | 7 minutes |
| Pico Rivera: | 5 minutes |
| La Mirada: | 5 minutes |
| Cerritos: | 5 minutes |
| Bellflower: | 4 minutes |
| Bell Gardens: | 5 minutes |
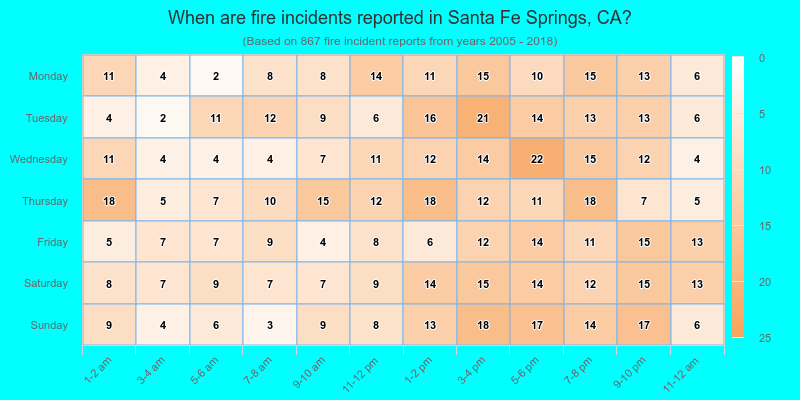
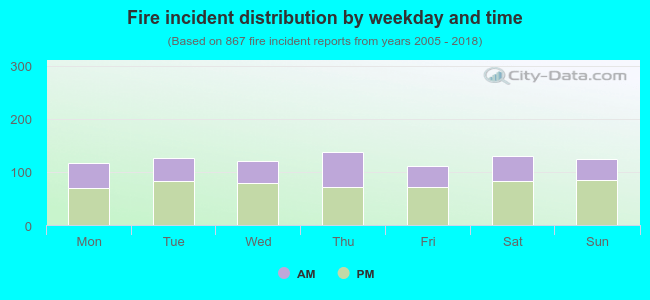 37.5% incidents where reported in the morning and 62.5% in the evening. The most fires (15.9%) took place on Thursday, and the least (12.8%) on Friday.
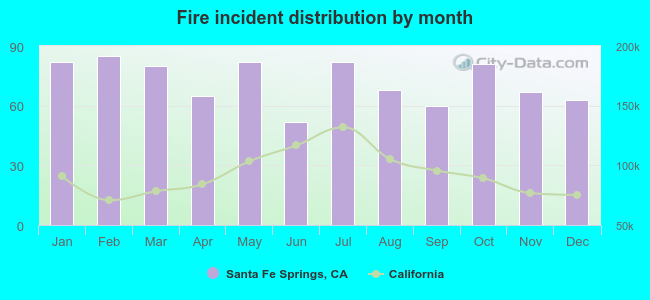 According to the 867 reports from years 2005 - 2018 most fires (9.8%) took place during February, and the least (6.0%) in June.
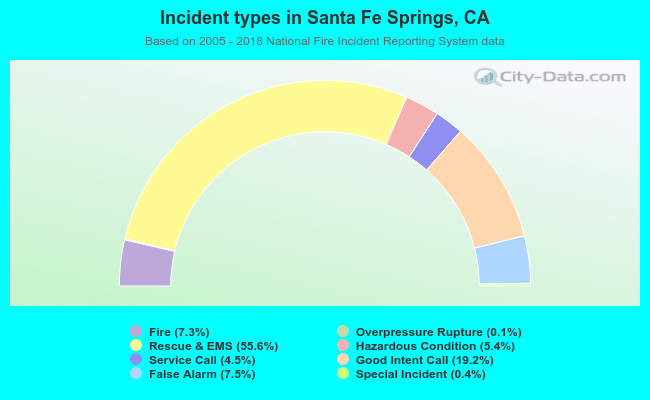 Out of all 11,948 cases reported during the years 2005 - 2018, the most belonged to the categories: Rescue & EMS (55.6%), Good Intent Call (19.2%), and False Alarm (7.5%).
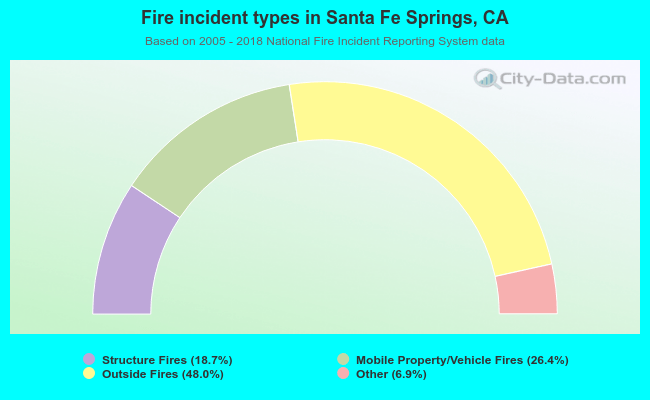 When looking into fire subcategories, the most reports belonged to: Outside Fires (48.0%), and Mobile Property/Vehicle Fires (26.4%).