| Fire incidents reported |
|---|
| Sreet name | Count |
|---|
| HWY 154 | 28 | | REFUGIO RD | 24 | | EDISON ST | 20 | | MISSION DR | 18 | | HWY 246 | 16 | | BASELINE AVE | 14 | | HAPPY CANYON RD | 12 | | SAGUNTO ST | 12 | | HIGH MEADOW RD | 8 | | KALAWA SHAQ | 6 | | SAMANTHA DR | 6 | | 1680 ALISOS AV RD | 4 | | AIRPORT RD | 4 | | ARMOUR RANCH RD | 4 | | BASELINE AV | 4 | | CALZADA AVE | 4 | | CUESTA ST | 4 | | FLETCHER WAY | 4 | | HURRICANE DECK MTN | 4 | | JANIN WY | 4 | | MANZANA ST | 4 | | MEADOWLARK RD | 4 | | MEADOWVALE RD | 4 | | MESA VERDE RD | 4 | | OLD CALZADA AVE | 4 |
| | | Fire incidents reported |
|---|
| Sreet name | Count |
|---|
| PINE ST | 4 | | QUAIL VALLEY RD | 4 | | SKY DR | 4 | | AIRPORT ROAD | 2 | | ALAMO PINTADO RD | 2 | | ALISOS AVE | 2 | | BASELINE | 2 | | BASELINE AV / N REFUGIO RD | 2 | | CABRILLO LN | 2 | | CALZADA AV | 2 | | CIMMERON | 2 | | ELK GROVE RD | 2 | | ENTRANCE RD | 2 | | HIGHLAND RD | 2 | | HIGHWAY 154 | 2 | | HWY 154 AVE | 2 | | HWY 246 HWY | 2 | | HWY. 154 | 2 | | LONG CANYON RD | 2 | | LONG VALLEY RD | 2 | | LOS PADRES FIRE DIST | 2 | | MADERA ST | 2 | | MORA AVE | 2 | | OAK GLEN RD | 2 | | |
|
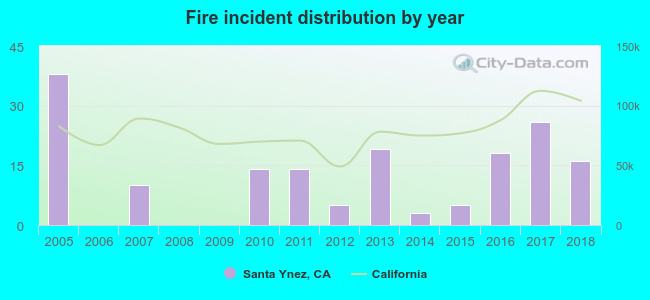 Based on the data from the years 2005 - 2018 the average number of fire incidents per year is 12. The highest number of fire incidents - 38 took place in 2005, and the least - 0 in 2006. The data has a decreasing trend.
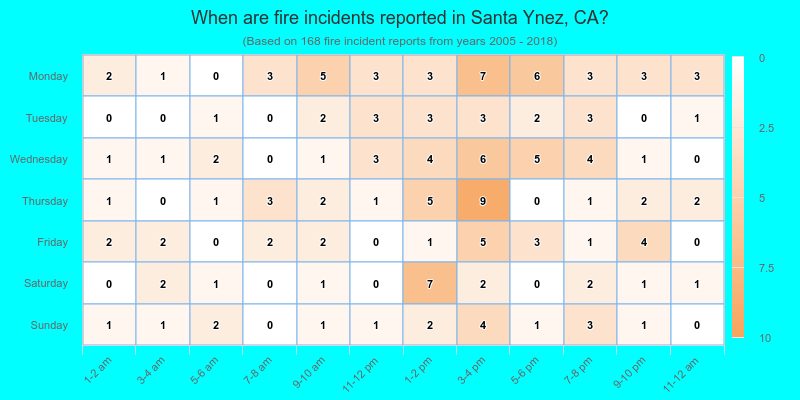
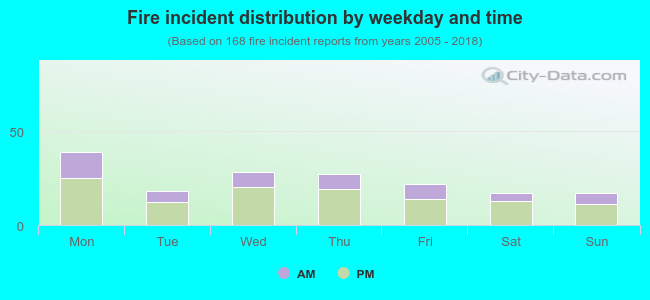 32.1% incidents where reported in the morning and 67.9% in the evening. The most fires (23.2%) took place on Monday, and the least (10.1%) on Saturday.
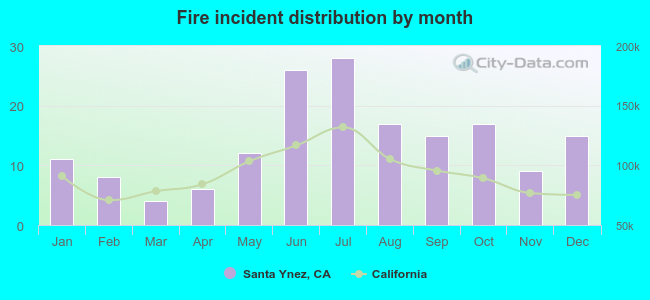 According to the 168 fires from years 2005 - 2018 most fires (16.7%) took place during July, and the least (2.4%) in March.
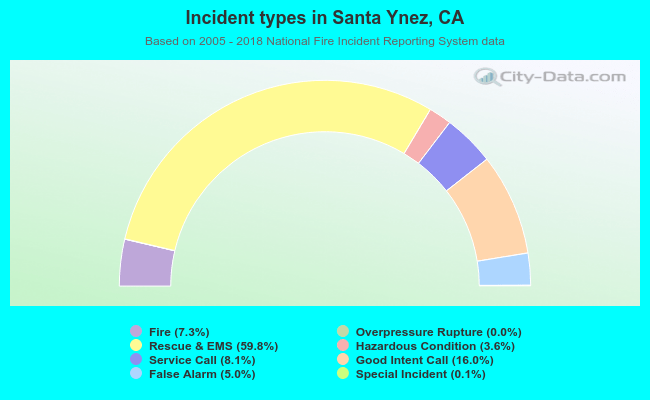 Out of all 2,290 cases reported during the years 2005 - 2018, the most belonged to the categories: Rescue & EMS (59.8%), Good Intent Call (16.0%), and Service Call (8.1%).
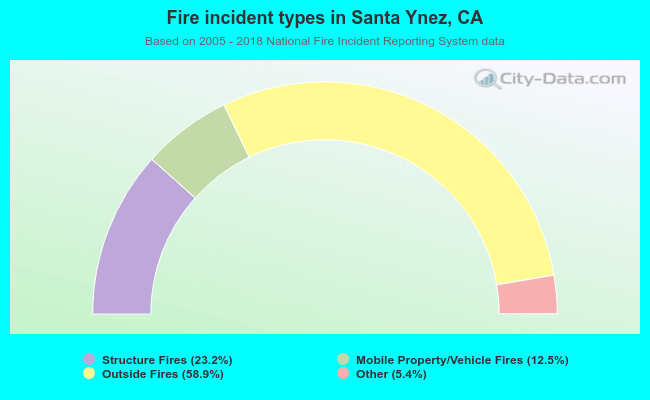 When looking into fire subcategories, the most reports belonged to: Outside Fires (58.9%), and Structure Fires (23.2%).