Sarasota: Fire Incidents, Florida (FL)
Where are fire incidents reported in Sarasota, FL
Something went wrong! Please refresh the page.
| Fire incidents reported | |
|---|---|
| Sreet name | Count |
| TAMIAMI | 200 |
| TAMIAMI TRL | 136 |
| FRUITVILLE | 96 |
| BENJAMIN FRANKLIN DR | 80 |
| I75 | 72 |
| UNIVERSITY PKY | 70 |
| LOCKWOOD RIDGE RD | 68 |
| OSPREY AVE | 68 |
| WASHINGTON BLVD | 64 |
| MAIN ST | 62 |
| RINGLING BLVD | 58 |
| TUTTLE AVE | 54 |
| WHITFIELD AVE | 52 |
| 10TH ST | 50 |
| CENTRAL AVE | 50 |
| ORANGE AVE | 48 |
| FRUITVILLE RD | 46 |
| TALLEVAST RD | 46 |
| 19TH ST | 40 |
| LOCKWOOD RIDGE | 38 |
| 12TH ST | 36 |
| 8TH ST | 36 |
| BEE RIDGE | 36 |
| 17TH ST | 34 |
| BAHIA VISTA ST | 34 |
| JANIE POE DR | 34 |
| N TAMIAMI | 34 |
| S TAMIAMI | 34 |
| 24TH ST | 32 |
| BENEVA | 32 |
| Other | 1,962 |
2002 - 2018 National Fire Incident Reporting System (NFIRS) incidents
- Incident types reported to NFIRS in Sarasota, FL
- 86,60981.1%Rescue & EMS
- 5,6825.3%False Alarm
- 4,1203.9%Good Intent Call
- 3,7023.5%Fire
- 3,6303.4%Hazardous Condition
- 2,7102.5%Service Call
- 1500.1%Special Incident
- Fire incident types reported to NFIRS in Sarasota, FL
- 1,90151.4%Outside Fires
- 1,03127.8%Structure Fires
- 63517.2%Mobile Property/Vehicle Fires
- 1353.6%Other
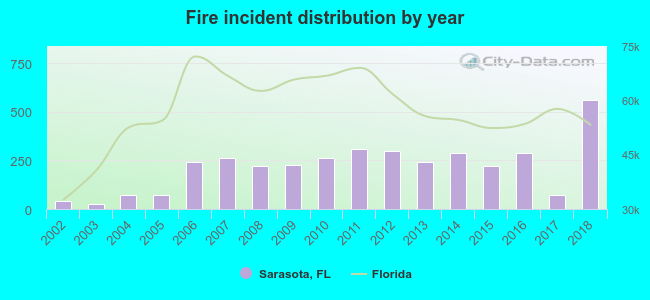 Based on the data from the years 2002 - 2018 the average number of fires per year is 218. The highest number of fires - 560 took place in 2018, and the least - 25 in 2003. The data has a rising trend.
The average number of yearly fire incidents per 10k residents in Sarasota, FL compared to nearest cities:
(Note: Based on data for the last 3 years, including only cities with population 5,000 and above)
| Sarasota: | 56.6 |
| Longboat Key: | 47.6 |
| Osprey: | 8.2 |
| Bradenton: | 129.0 |
| Myakka: | 0.9 |
| Palmetto: | 59.1 |
| Venice: | 72.4 |
| Parrish: | 46.8 |
| South Venice: | 1.4 |
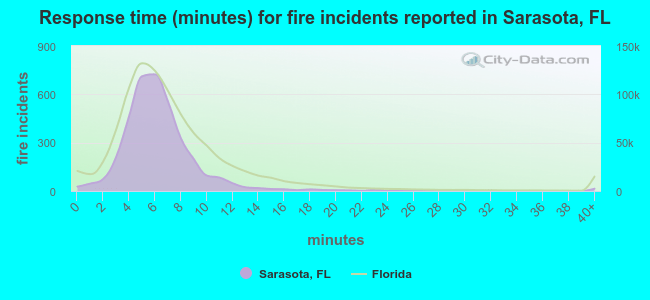 The median response time based on all reported fire incidents is 6 minutes. This is close to the state median value.
The median response time in Sarasota, FL compared to nearest cities:
(Note: Based on data for all years, including only cities with at least 500 fire incidents)
| Sarasota: | 6 minutes |
| Bradenton: | 5 minutes |
| Palmetto: | 6 minutes |
| Nokomis: | 6 minutes |
| Venice: | 6 minutes |
| Parrish: | 6 minutes |
| Ruskin: | 10 minutes |
| Englewood: | 6 minutes |
| North Port: | 7 minutes |
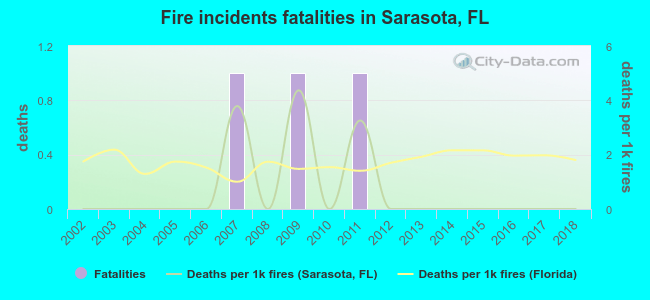 According to the reports from the years 2002 - 2018 the average number of fire-related fatalities per year is 0. The highest number of deaths - 1 took place in 2007, and the lowest - 0 in 2002. The data has a constant trend.
The average number of deaths per 1,000 fire incidents is 1. This indicator was the highest - 4 in 2009, and the lowest 0 in 2002. The trend for fatalities per 1,000 incidents is constant. Compared to the state value the number of fatalities per 1,000 fire incidents is much lower.
According to the reports from the years 2002 - 2018 the average number of fire-related fatalities per year is 0. The highest number of deaths - 1 took place in 2007, and the lowest - 0 in 2002. The data has a constant trend.
The average number of deaths per 1,000 fire incidents is 1. This indicator was the highest - 4 in 2009, and the lowest 0 in 2002. The trend for fatalities per 1,000 incidents is constant. Compared to the state value the number of fatalities per 1,000 fire incidents is much lower.Deaths per 1,000 incidents in Sarasota, FL compared to nearest cities:
(Note: Based on data for all years, including only cities with at least 2,500 fire incidents)
| Sarasota: | 0.8 |
| Bradenton: | 1.1 |
| North Port: | 0.6 |
| St. Petersburg: | 0.9 |
| Port Charlotte: | 0.8 |
| Pinellas Park: | 2.3 |
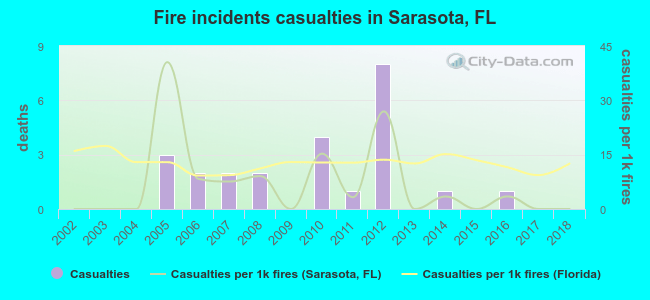 According to the data from the years 2002 - 2018 the average number of fire-related casualties per year is 1. The highest number of reported injuries - 8 took place in 2012, and the lowest - 0 in 2002. The data has a constant trend.
The average number of casualties per 1,000 fires is 7. This indicator was the highest - 41 in 2005, and the lowest 0 in 2002. The trend for casualties per 1,000 fires is increasing. Compared to the Florida value the number of casualties per 1,000 fire incidents is lower.
According to the data from the years 2002 - 2018 the average number of fire-related casualties per year is 1. The highest number of reported injuries - 8 took place in 2012, and the lowest - 0 in 2002. The data has a constant trend.
The average number of casualties per 1,000 fires is 7. This indicator was the highest - 41 in 2005, and the lowest 0 in 2002. The trend for casualties per 1,000 fires is increasing. Compared to the Florida value the number of casualties per 1,000 fire incidents is lower.
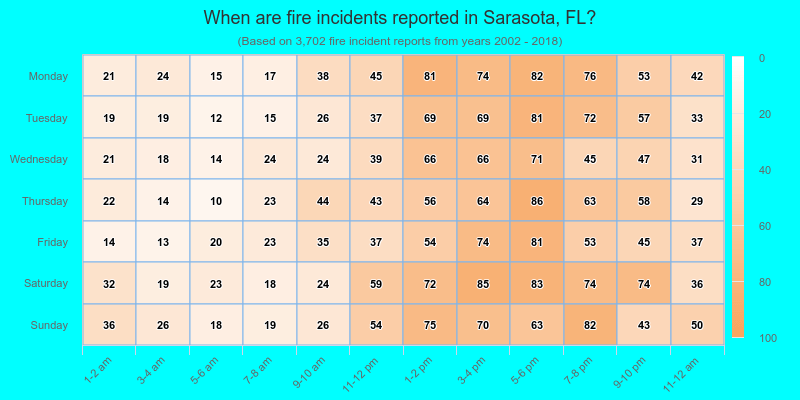
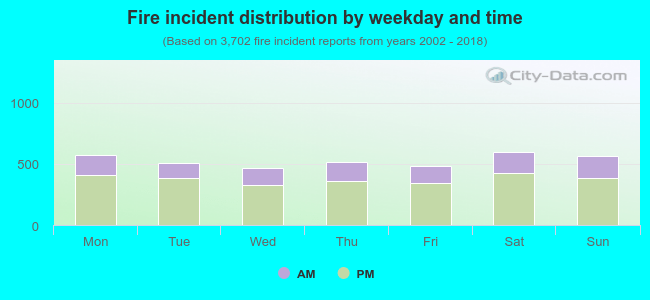 29.2% incidents where reported in the morning and 70.8% in the evening. The most fires (16.2%) took place on Saturday, and the least (12.6%) on Wednesday.
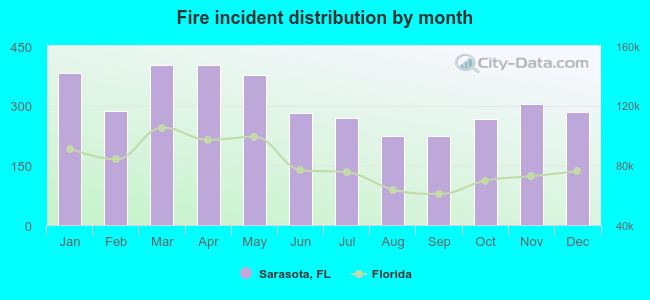 Based on the 3,702 incident reports from years 2002 - 2018 most fires (10.9%) took place during March, and the least (6.0%) in August.
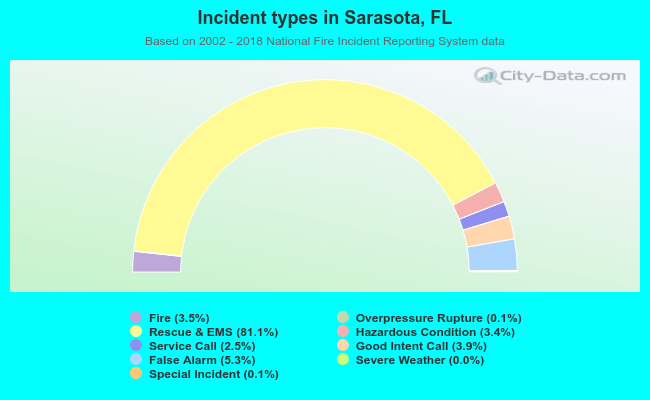 Out of all 106,729 cases reported during the years 2002 - 2018, the most belonged to the categories: Rescue & EMS (81.1%), False Alarm (5.3%), and Good Intent Call (3.9%).
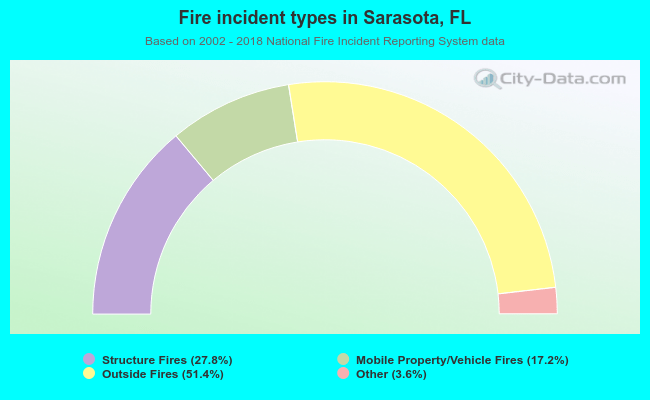 When looking into fire subcategories, the most reports belonged to: Outside Fires (51.4%), and Structure Fires (27.8%).