| Fire incidents reported |
|---|
| Sreet name | Count |
|---|
| 36137 EW 140 | 6 | | HWY 56 | 6 | | NS 362 | 6 | | 35858 HWY 56 | 4 | | CR 361 | 4 | | CR 364 | 4 | | EW 138 | 4 | | EW 138 #36122 | 4 | | EW 143 | 4 | | EW137 | 4 | | S OLIVE ST | 4 | | SASAKWA | 4 | | 1 1/4 N OF 56 HWY | 2 | | 12 E OF 1S 359 ON HWY 56 | 2 | | 13167 NS 357 | 2 | | 13530 HWY 56 | 2 | | 13537 NS 361 | 2 | | 13759 NS 361 | 2 | | 138 & 362 | 2 | | 13841 NS 364 RD | 2 | | 139 | 2 | | 139 AND HWY 56 | 2 | | 13950 HWY 56 | 2 | | 14069 NS 3615 | 2 | | 14147 NS 3670 | 2 |
| | | Fire incidents reported |
|---|
| Sreet name | Count |
|---|
| 14154 NS 360 | 2 | | 14185 NS 161 | 2 | | 14196 3625 | 2 | | 14285 NS 3606 | 2 | | 14319 NS 365 | 2 | | 14378 NS 363 | 2 | | 1450 & 3630 | 2 | | 35893 HWY 56 | 2 | | 35915 EW 145 | 2 | | 35926 HWY 56 | 2 | | 35933 EW1410 | 2 | | 35989 EW 144 | 2 | | 36075 HWY 56 | 2 | | 36079 HWY 56 | 2 | | 361 HWY 56 | 2 | | 36103 EW 140 | 2 | | 36122 EW 138 | 2 | | 36182 HWY 56 | 2 | | 362 | 2 | | 362.5 | 2 | | 363 147 | 2 | | 36371 EW 146 | 2 | | 3640/1450 INTERSECTION | 2 | | 36515 EW 145 | 2 | | |
|
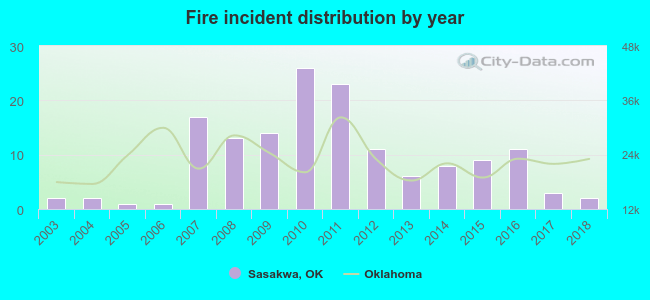 Based on the data from the years 2003 - 2018 the average number of fire incidents per year is 9. The highest number of reported fires - 26 took place in 2010, and the least - 1 in 2005. The data has a constant trend.
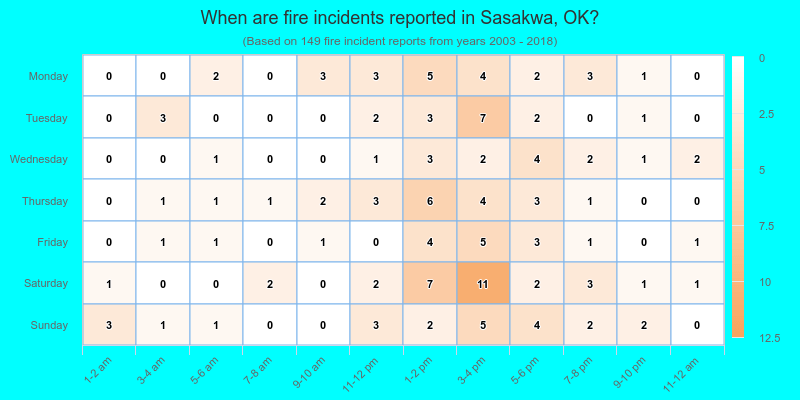
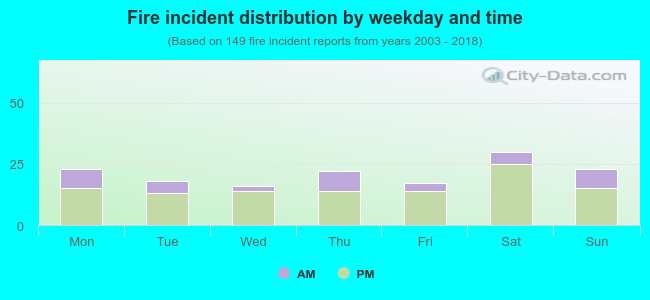 26.2% incidents where reported in the morning and 73.8% in the evening. The most fires (20.1%) took place on Saturday, and the least (10.7%) on Wednesday.
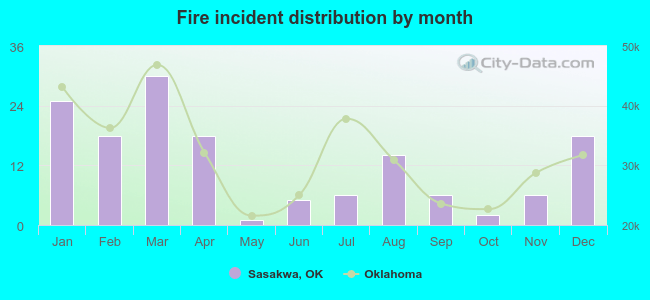 According to the 149 reports from years 2003 - 2018 most fires (20.1%) took place during March, and the least (0.7%) in May.
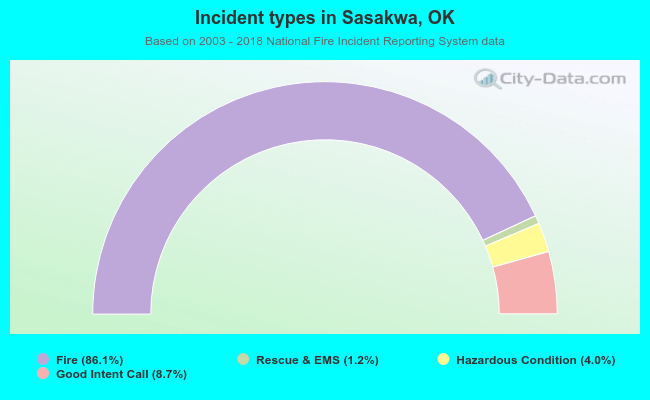 Out of all 173 cases reported during the years 2003 - 2018, the most belonged to the categories: Fire (86.1%), Hazardous Condition (8.7%), and Rescue & EMS (4.0%).
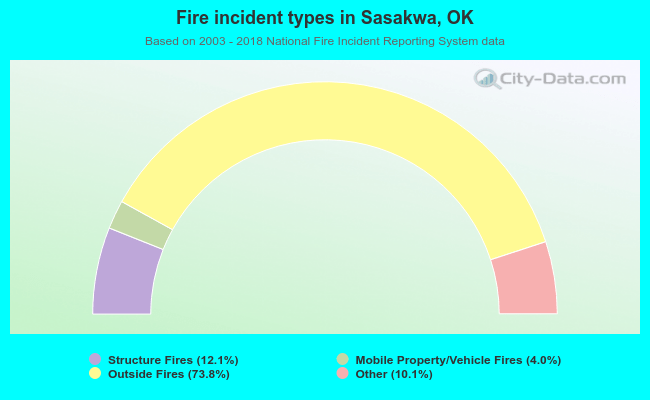 When looking into fire subcategories, the most incidents belonged to: Outside Fires (73.8%), and Structure Fires (12.1%).