Sea Bright: Fire Incidents, New Jersey (NJ)
Where are fire incidents reported in Sea Bright, NJ
Something went wrong! Please refresh the page.
|
| |||||||||||||||||||||||||||||||||||||||||||||||||||||||||||||||||||||||||||||||||||||||||||||
2004 - 2018 National Fire Incident Reporting System (NFIRS) incidents
- Incident types reported to NFIRS in Sea Bright, NJ
- 59036.8%Hazardous Condition
- 27817.3%False Alarm
- 24315.2%Fire
- 19812.4%Good Intent Call
- 17811.1%Rescue & EMS
- 1046.5%Service Call
- 100.6%Special Incident
- 20.1%Severe Weather
- Fire incident types reported to NFIRS in Sea Bright, NJ
- 13656.0%Structure Fires
- 8535.0%Outside Fires
- 166.6%Mobile Property/Vehicle Fires
- 62.5%Other
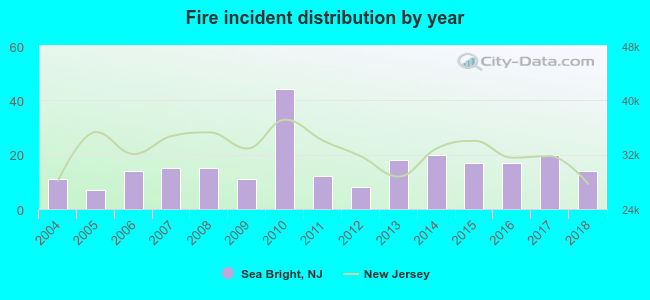 Based on the data from the years 2004 - 2018 the average number of fires per year is 16. The highest number of reported fires - 44 took place in 2010, and the least - 7 in 2005. The data has an increasing trend.
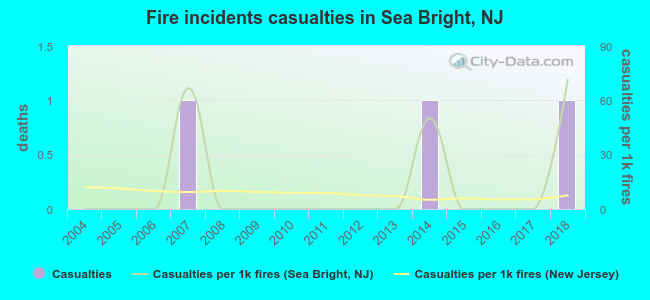 Based on the data from the years 2004 - 2018 the average number of fire-related yearly casualties is 0. The highest number of injuries - 1 took place in 2007, and the lowest - 0 in 2004. The data has a growing trend.
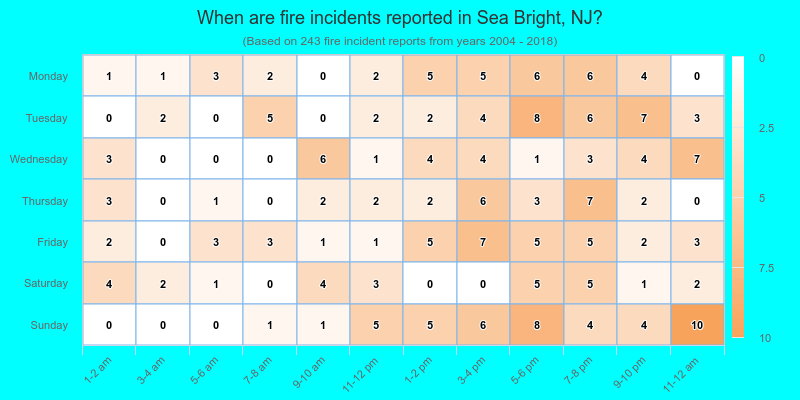
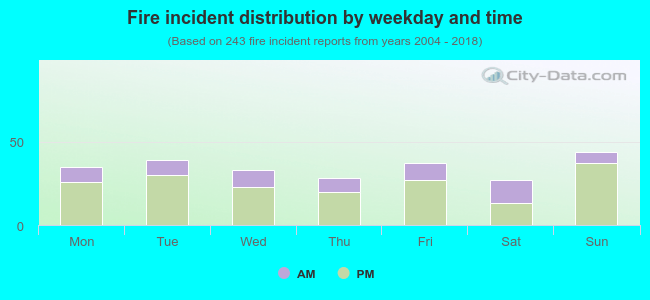 27.6% incidents where reported in the morning and 72.4% in the evening. The most fires (18.1%) took place on Sunday, and the least (11.1%) on Saturday.
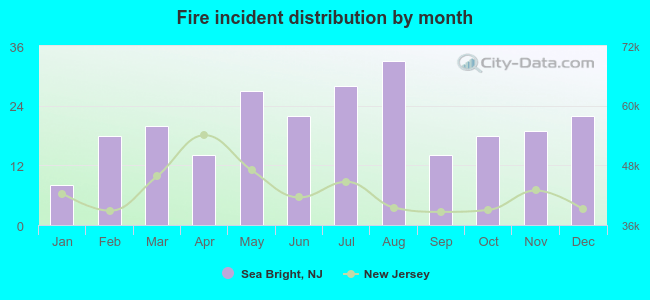 Based on the 243 fires from years 2004 - 2018 most fires (13.6%) took place during August, and the least (3.3%) in January.
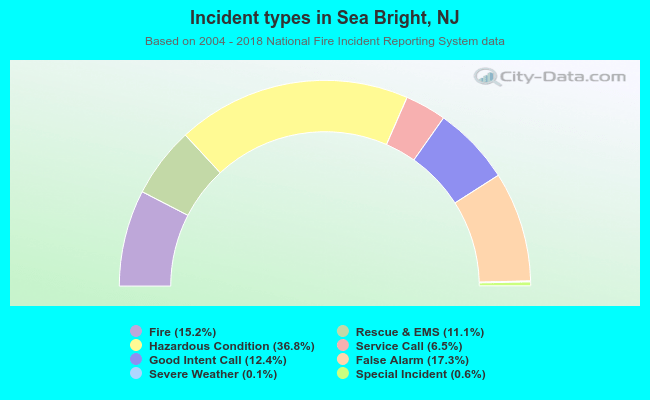 Out of all 1,603 cases reported during the years 2004 - 2018, the most belonged to the categories: Rescue & EMS (36.8%), Good Intent Call (17.3%), and Fire (15.2%).
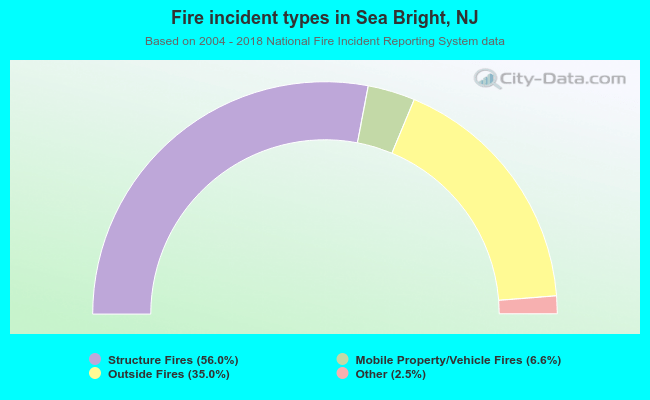 When looking into fire subcategories, the most reports belonged to: Structure Fires (56.0%), and Outside Fires (35.0%).