Seville: Fire Incidents, Ohio (OH)
Where are fire incidents reported in Seville, OH
Something went wrong! Please refresh the page.
|
| |||||||||||||||||||||||||||||||||||||||||||||||||||||||||||||||||||||||||||||||||||||||||||||||||||||||||||||
2002 - 2018 National Fire Incident Reporting System (NFIRS) incidents
- Incident types reported to NFIRS in Seville, OH
- 1,19156.2%Rescue & EMS
- 38618.2%Fire
- 1878.8%Hazardous Condition
- 1356.4%Service Call
- 1085.1%Good Intent Call
- 1024.8%False Alarm
- 70.3%Special Incident
- 40.2%Overpressure Rupture
- Fire incident types reported to NFIRS in Seville, OH
- 22257.5%Structure Fires
- 8923.1%Outside Fires
- 7419.2%Mobile Property/Vehicle Fires
- 10.3%Other
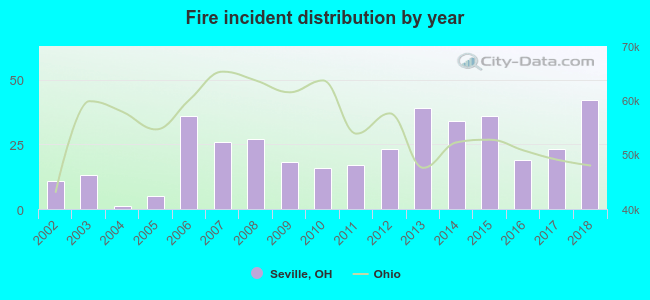 Based on the data from the years 2002 - 2018 the average number of fire incidents per year is 23. The highest number of fire incidents - 42 took place in 2018, and the least - 1 in 2004. The data has a rising trend.
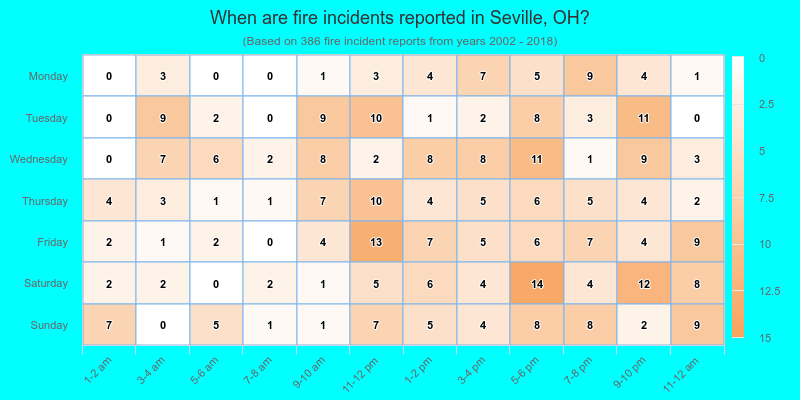
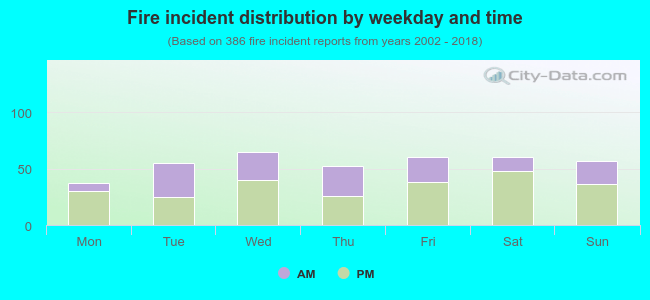 37.0% incidents where reported in the morning and 63.0% in the evening. The most fires (16.8%) took place on Wednesday, and the least (9.6%) on Monday.
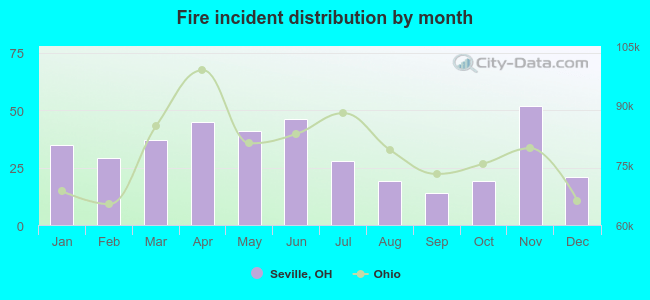 According to the 386 reports from years 2002 - 2018 most fires (13.5%) took place during November, and the least (3.6%) in September.
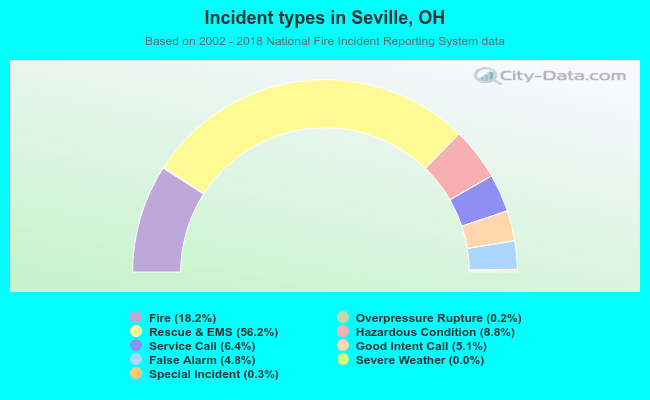 Out of all 2,121 cases reported during the years 2002 - 2018, the most belonged to the categories: Rescue & EMS (56.2%), Fire (18.2%), and Hazardous Condition (8.8%).
 When looking into fire subcategories, the most reports belonged to: Structure Fires (57.5%), and Outside Fires (23.1%).