Sharpsburg: Fire Incidents, Pennsylvania (PA)
Where are fire incidents reported in Sharpsburg, PA
Something went wrong! Please refresh the page.
|
| |||||||||||||||||||||||||||||||||||||||||||||||||||||||||||||||||||||||||||||||||||||||||||||||||||||||||
2004 - 2018 National Fire Incident Reporting System (NFIRS) incidents
- Incident types reported to NFIRS in Sharpsburg, PA
- 37637.4%Good Intent Call
- 18718.6%Hazardous Condition
- 13913.8%Fire
- 13513.4%Rescue & EMS
- 858.5%False Alarm
- 737.3%Service Call
- 70.7%Severe Weather
- 20.2%Special Incident
- Fire incident types reported to NFIRS in Sharpsburg, PA
- 10172.7%Structure Fires
- 1611.5%Outside Fires
- 1410.1%Other
- 85.8%Mobile Property/Vehicle Fires
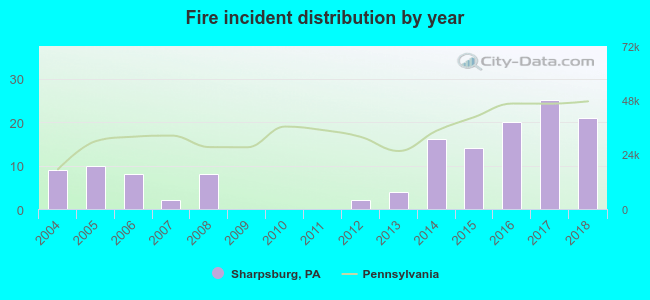 According to the data from the years 2004 - 2018 the average number of fires per year is 9. The highest number of fire incidents - 25 took place in 2017, and the least - 0 in 2009. The data has an increasing trend.
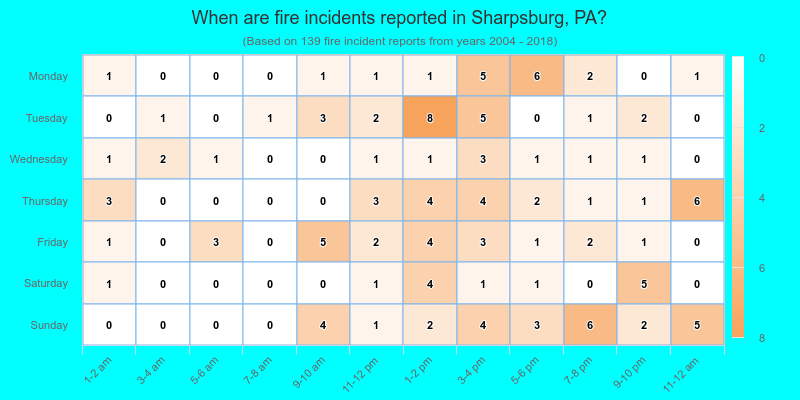
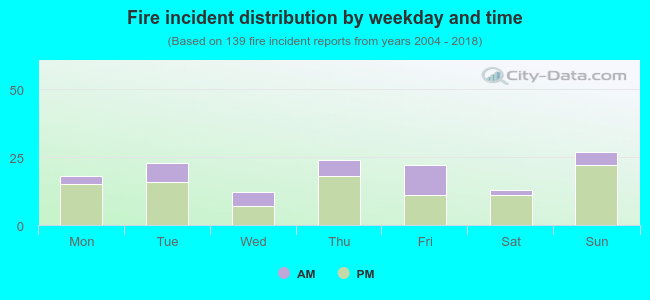 28.1% incidents where reported in the morning and 71.9% in the evening. The most fires (19.4%) took place on Sunday, and the least (8.6%) on Wednesday.
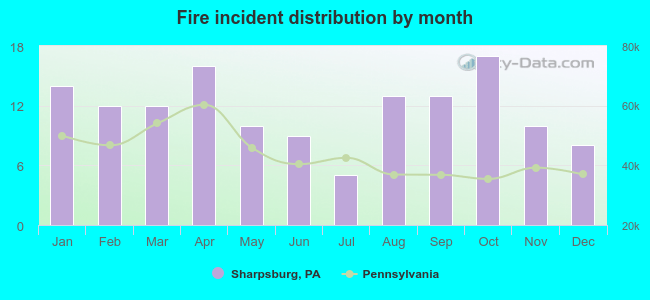 Based on the 139 fires from years 2004 - 2018 most fires (12.2%) took place during October, and the least (3.6%) in July.
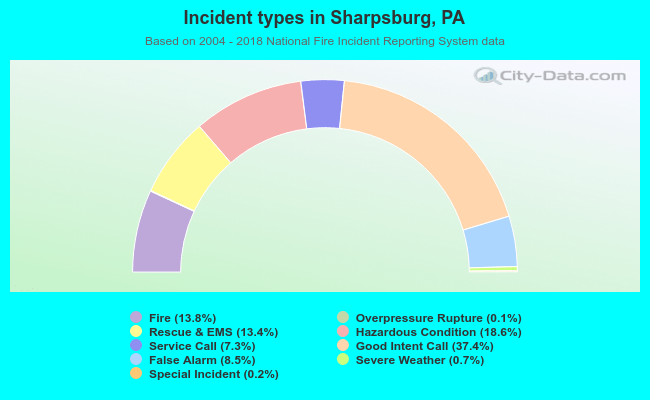 Out of all 1,005 cases reported during the years 2004 - 2018, the most belonged to the categories: Good Intent Call (37.4%), Hazardous Condition (18.6%), and Fire (13.8%).
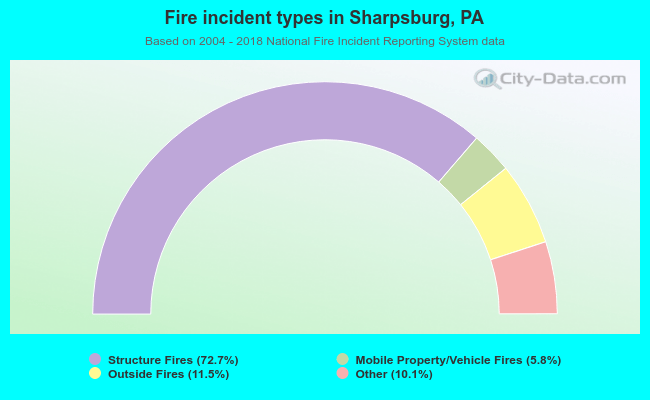 When looking into fire subcategories, the most reports belonged to: Structure Fires (72.7%), and Outside Fires (11.5%).