| Fire incidents reported |
|---|
| Sreet name | Count |
|---|
| SHASTA DAM | 20 | | LAKE BLVD | 16 | | SHASTA DAM BLVD | 16 | | ASHBY RD | 10 | | ELIZABETH AVE | 10 | | FORT PECK ST | 10 | | FRONT ST | 10 | | FRONT ST | 10 | | PINE GROVE AVE | 10 | | CASCADE BLVD | 8 | | EL CAJON AVE | 8 | | ASHBY | 6 | | ELIZABETH | 6 | | MONTANA AVE | 6 | | RIDDLE RD | 6 | | WASHINGTON | 6 | | ASHBY CT | 4 | | BLACK CANYON RD | 4 | | CABELLO ST | 4 | | EL CAJON | 4 | | INTERSTATE 5 | 4 | | IVY AVE | 4 | | MAIN ST | 4 | | RED BUD LANE | 4 | | ROSAMOND AVE | 4 |
| | | Fire incidents reported |
|---|
| Sreet name | Count |
|---|
| WASHINGTON AVE | 4 | | WEBSTER ST | 4 | | 2052 ROSEMAND AVE | 2 | | 4342 TEMPLE LN | 2 | | AKRICH PARK AVE | 2 | | ASHBY RD/PINE GROVE AVE | 2 | | AUTOM HARVEST | 2 | | AUTUM HARVEST WY | 2 | | AUTUMN HARVEST WAY | 2 | | BASS DR | 2 | | BASS DR | 2 | | BLACK OAK | 2 | | BLOOMSBURY AVE | 2 | | BOB'S MOUTAIN RD | 2 | | BRONZE CT | 2 | | BUTTERFLY LN | 2 | | CASA DR | 2 | | CASCADE | 2 | | CASCADE BLVD @ PINE GROVE AVE | 2 | | CASDADE BLVD. | 2 | | CENTRAL AVE | 2 | | CHICO | 2 | | COPPER CANYON RD | 2 | | D'ALENE AVE | 2 | | |
|
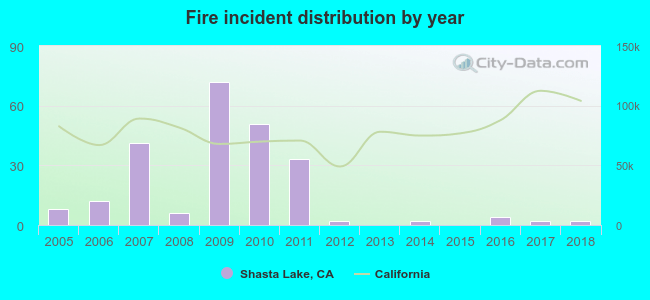 According to the data from the years 2005 - 2018 the average number of fires per year is 17. The highest number of reported fire incidents - 72 took place in 2009, and the least - 0 in 2013. The data has a decreasing trend.
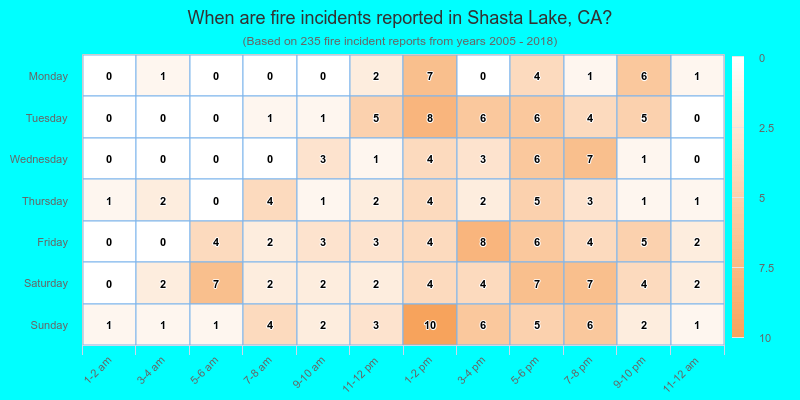
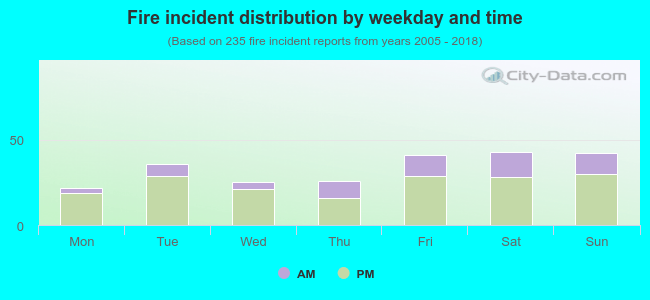 26.8% incidents where reported in the morning and 73.2% in the evening. The most fires (18.3%) took place on Saturday, and the least (9.4%) on Monday.
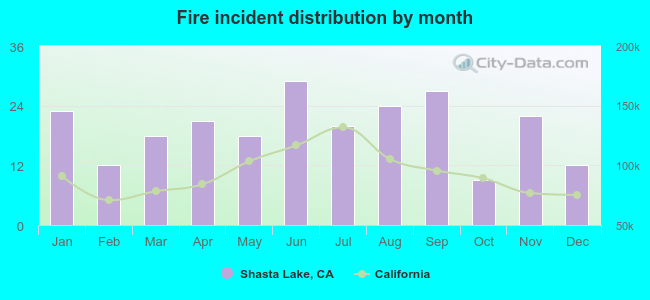 Based on the 235 reports from years 2005 - 2018 most fires (12.3%) took place during June, and the least (3.8%) in October.
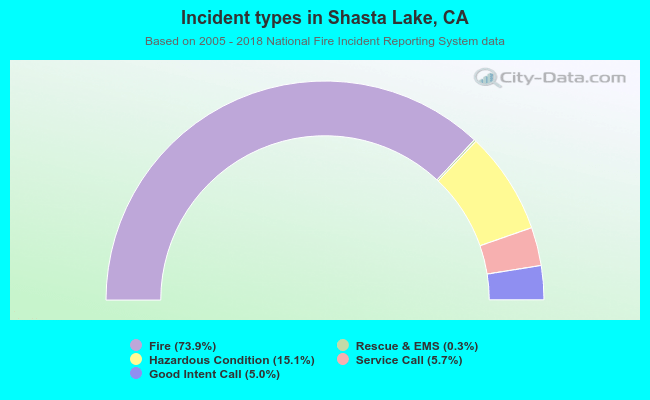 Out of all 318 cases reported during the years 2005 - 2018, the most belonged to the categories: Fire (73.9%), Rescue & EMS (15.1%), and Hazardous Condition (5.7%).
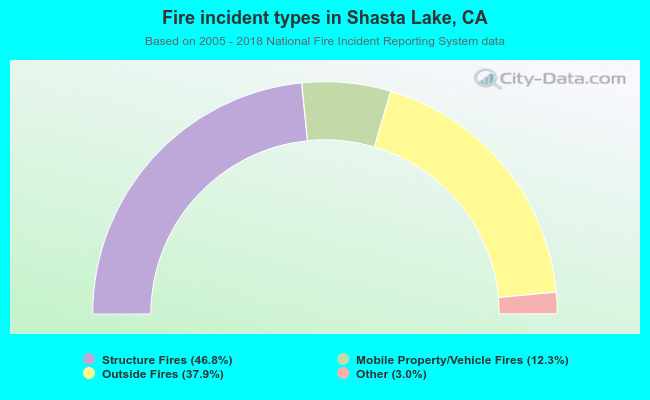 When looking into fire subcategories, the most reports belonged to: Structure Fires (46.8%), and Outside Fires (37.9%).