Ship Bottom: Fire Incidents, New Jersey (NJ)
Where are fire incidents reported in Ship Bottom, NJ
Something went wrong! Please refresh the page.
|
| |||||||||||||||||||||||||||||||||||||||||||||||||||||||||||||||||||||||||||||||||||||||||||||||||||||||||||||
2003 - 2018 National Fire Incident Reporting System (NFIRS) incidents
- Incident types reported to NFIRS in Ship Bottom, NJ
- 38251.1%Hazardous Condition
- 23932.0%Fire
- 506.7%False Alarm
- 334.4%Rescue & EMS
- 222.9%Service Call
- 202.7%Good Intent Call
- 10.1%Special Incident
- Fire incident types reported to NFIRS in Ship Bottom, NJ
- 10845.2%Structure Fires
- 5824.3%Other
- 5523.0%Outside Fires
- 187.5%Mobile Property/Vehicle Fires
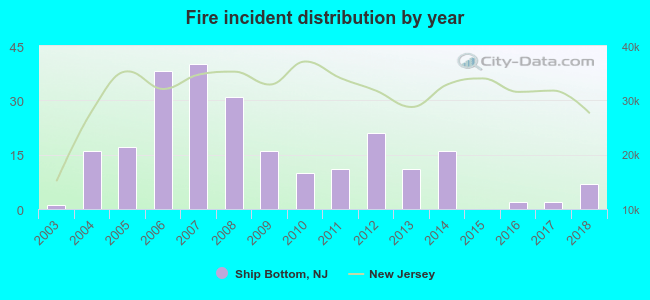 According to the data from the years 2003 - 2018 the average number of fires per year is 15. The highest number of reported fires - 40 took place in 2007, and the least - 0 in 2015. The data has a growing trend.
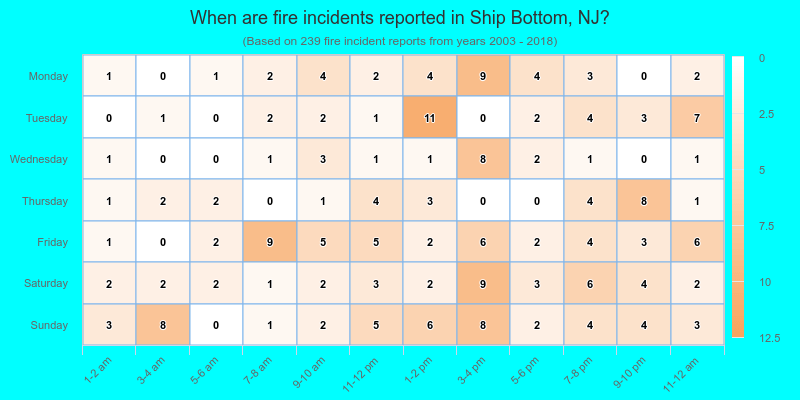
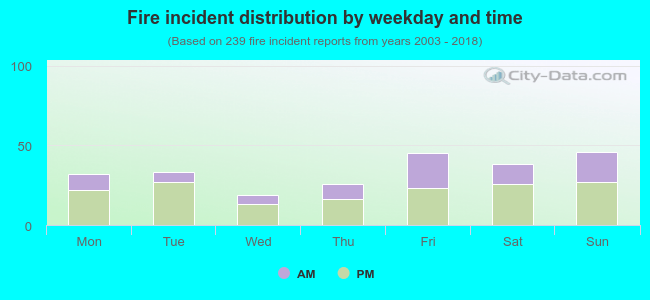 35.6% incidents where reported in the morning and 64.4% in the evening. The most fires (19.2%) took place on Sunday, and the least (7.9%) on Wednesday.
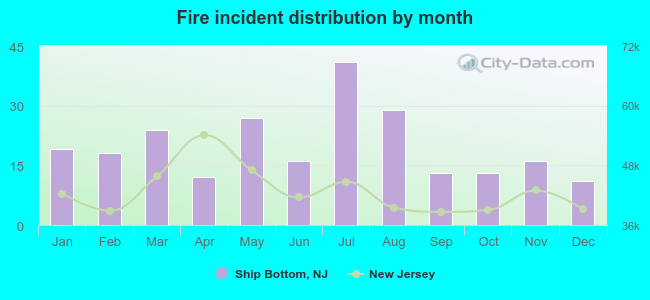 According to the 239 fires from years 2003 - 2018 most fires (17.2%) took place during July, and the least (4.6%) in December.
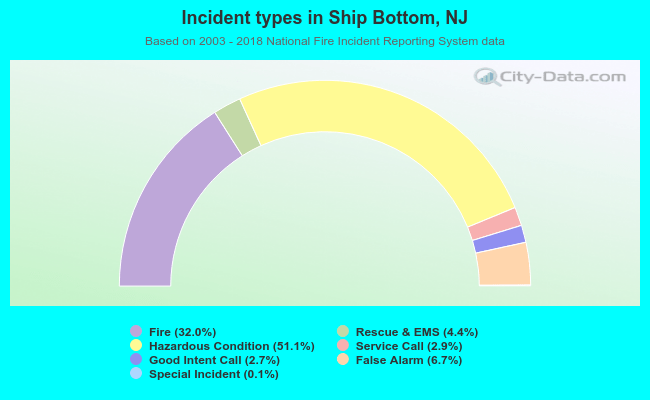 Out of all 747 cases reported during the years 2003 - 2018, the most belonged to the categories: Rescue & EMS (51.1%), Fire (32.0%), and Good Intent Call (6.7%).
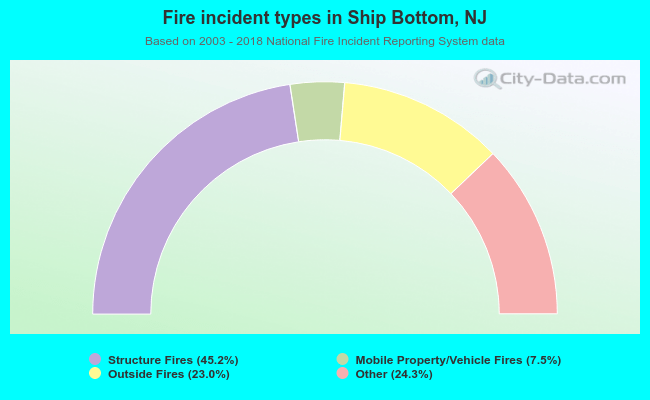 When looking into fire subcategories, the most incidents belonged to: Structure Fires (45.2%), and Other (24.3%).