Shively: Fire Incidents, Kentucky (KY)
Where are fire incidents reported in Shively, KY
Something went wrong! Please refresh the page.
|
| |||||||||||||||||||||||||||||||||||||||||||||||||||||||||||||||||||||||||||||||||||||||||||||||||||||||||||||
2002 - 2018 National Fire Incident Reporting System (NFIRS) incidents
- Incident types reported to NFIRS in Shively, KY
- 71826.2%Rescue & EMS
- 70425.7%Hazardous Condition
- 49217.9%Good Intent Call
- 35412.9%False Alarm
- 31311.4%Fire
- 1455.3%Service Call
- 90.3%Special Incident
- 60.2%Overpressure Rupture
- 30.1%Severe Weather
- Fire incident types reported to NFIRS in Shively, KY
- 12941.2%Structure Fires
- 9430.0%Mobile Property/Vehicle Fires
- 8527.2%Outside Fires
- 51.6%Other
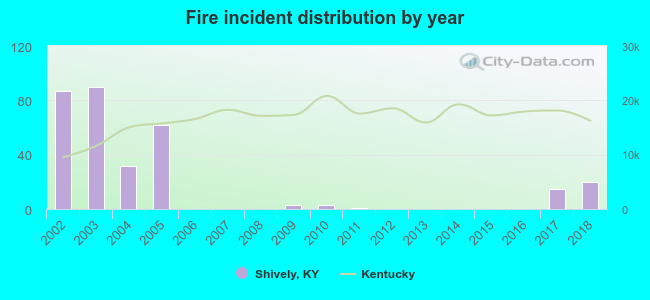 According to the data from the years 2002 - 2018 the average number of fire incidents per year is 18. The highest number of fires - 90 took place in 2003, and the least - 0 in 2006. The data has a decreasing trend.
The average number of yearly fire incidents per 10k residents in Shively, KY compared to nearest cities:
(Note: Based on data for the last 3 years, including only cities with population 5,000 and above)
| Shively: | 11.2 |
| Louisville: | 99.8 |
| Fairdale: | 29.7 |
| Okolona: | 0.5 |
| Hillview: | 7.5 |
| Fern Creek: | 25.6 |
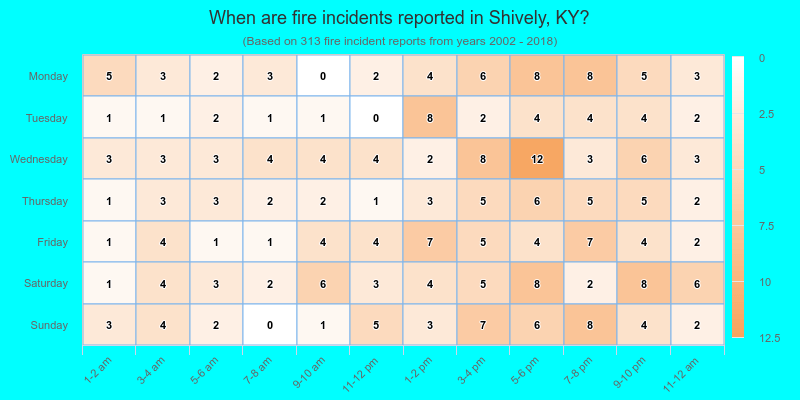
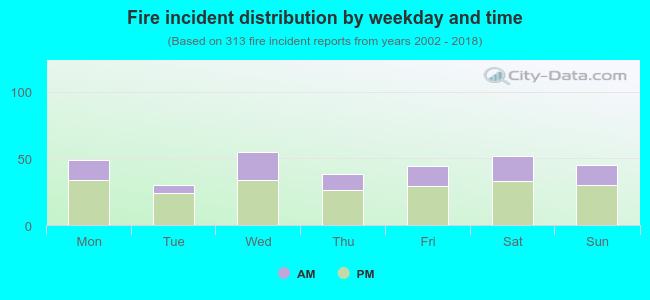 32.9% incidents where reported in the morning and 67.1% in the evening. The most fires (17.6%) took place on Wednesday, and the least (9.6%) on Tuesday.
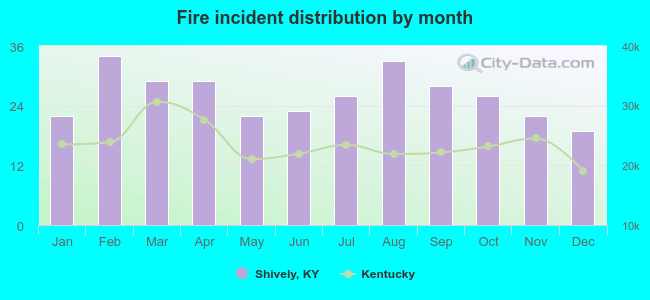 Based on the 313 fire incidents from years 2002 - 2018 most fires (10.9%) took place during February, and the least (6.1%) in December.
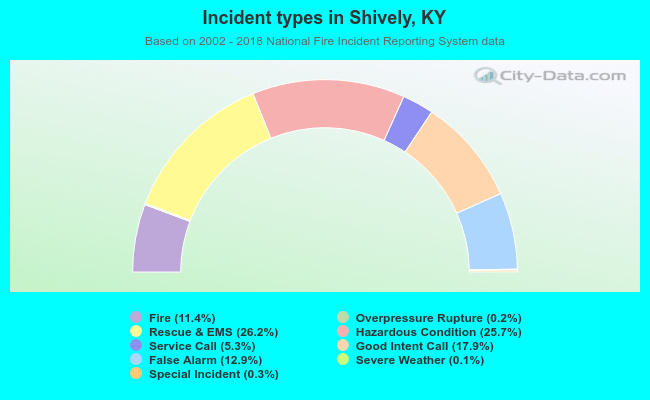 Out of all 2,744 cases reported during the years 2002 - 2018, the most belonged to the categories: Rescue & EMS (26.2%), Hazardous Condition (25.7%), and Good Intent Call (17.9%).
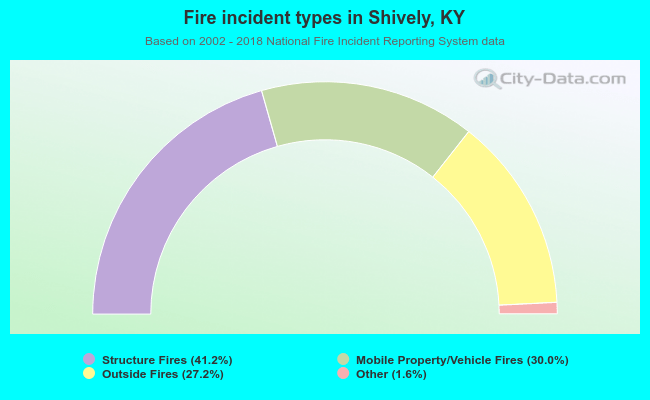 When looking into fire subcategories, the most reports belonged to: Structure Fires (41.2%), and Mobile Property/Vehicle Fires (30.0%).