Shorewood: Fire Incidents, Wisconsin (WI)
Where are fire incidents reported in Shorewood, WI
Something went wrong! Please refresh the page.
|
| |||||||||||||||||||||||||||||||||||||||||||||||||||||||||||||||||||||||||||||||||||||||||||||||||||||||||||||
2004 - 2018 National Fire Incident Reporting System (NFIRS) incidents
- Incident types reported to NFIRS in Shorewood, WI
- 2,95662.5%Rescue & EMS
- 82917.5%False Alarm
- 4489.5%Hazardous Condition
- 2244.7%Fire
- 1272.7%Service Call
- 1172.5%Good Intent Call
- 150.3%Overpressure Rupture
- 140.3%Special Incident
- Fire incident types reported to NFIRS in Shorewood, WI
- 13058.0%Structure Fires
- 7533.5%Outside Fires
- 177.6%Mobile Property/Vehicle Fires
- 20.9%Other
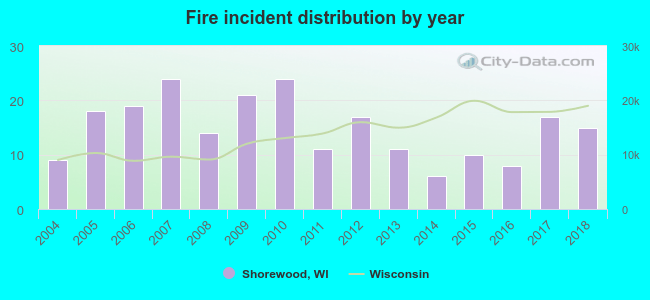 According to the data from the years 2004 - 2018 the average number of fires per year is 15. The highest number of reported fire incidents - 24 took place in 2007, and the least - 6 in 2014. The data has a rising trend.
The average number of yearly fire incidents per 10k residents in Shorewood, WI compared to nearest cities:
(Note: Based on data for the last 3 years, including only cities with population 5,000 and above)
| Shorewood: | 10.0 |
| Whitefish Bay: | 7.1 |
| Glendale: | 23.0 |
| Milwaukee: | 33.6 |
| Fox Point: | 10.9 |
| Brown Deer: | 13.5 |
| Wauwatosa: | 16.1 |
| West Allis: | 18.9 |
| Mequon: | 6.0 |

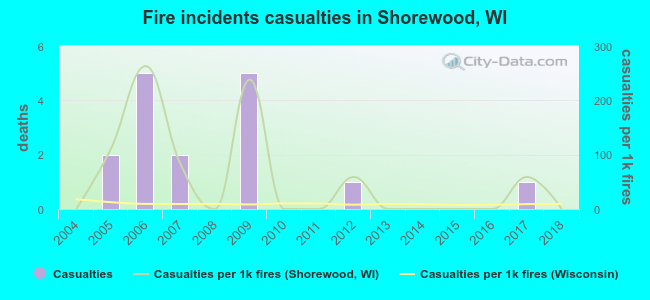 According to the reports from the years 2004 - 2018 the average number of fire-related casualties per year is 1. The highest number of casualties - 5 took place in 2006, and the lowest - 0 in 2004. The data has a constant trend.
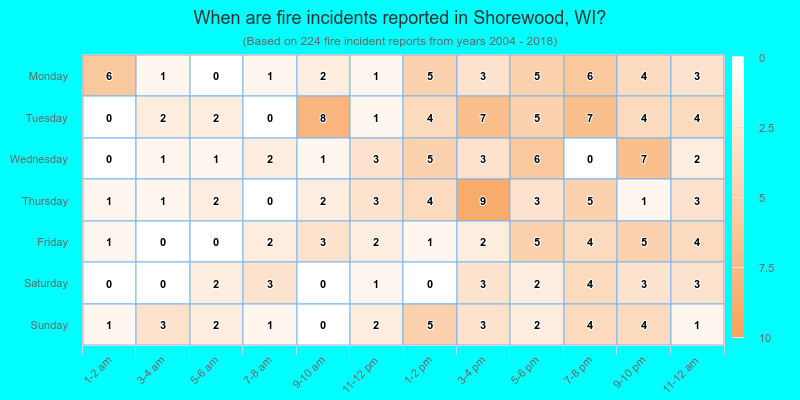
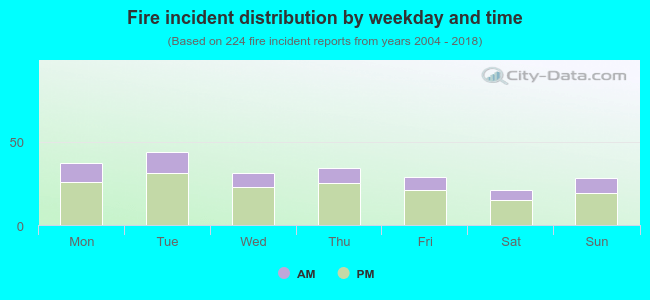 28.6% incidents where reported in the morning and 71.4% in the evening. The most fires (19.6%) took place on Tuesday, and the least (9.4%) on Saturday.
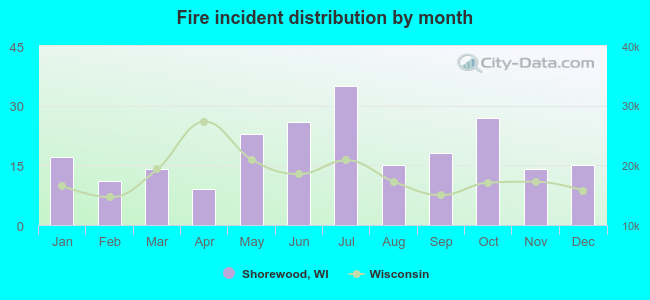 According to the 224 fire incidents from years 2004 - 2018 most fires (15.6%) took place during July, and the least (4.0%) in April.
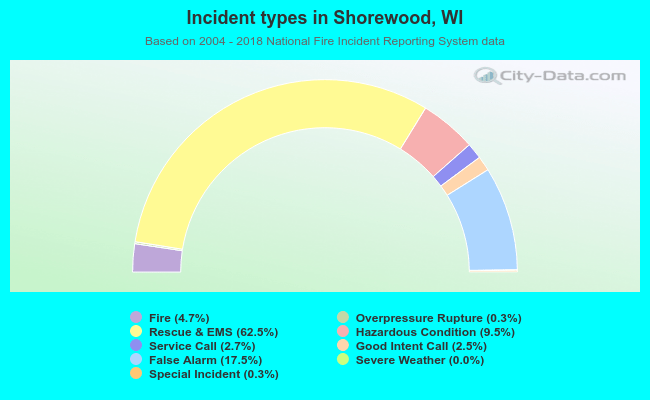 Out of all 4,731 cases reported during the years 2004 - 2018, the most belonged to the categories: Rescue & EMS (62.5%), False Alarm (17.5%), and Hazardous Condition (9.5%).
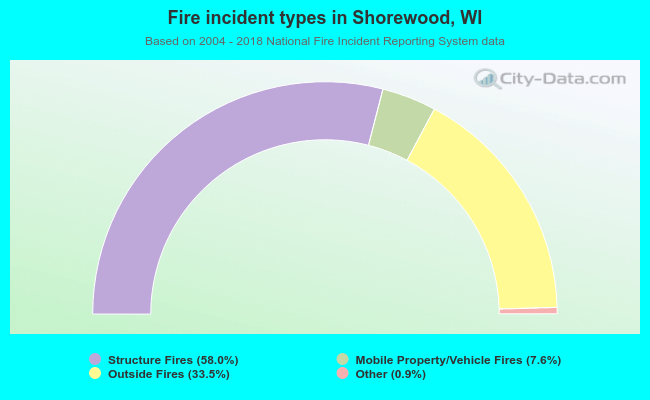 When looking into fire subcategories, the most incidents belonged to: Structure Fires (58.0%), and Outside Fires (33.5%).