Smithtown: Fire Incidents, New York (NY)
Where are fire incidents reported in Smithtown, NY
Something went wrong! Please refresh the page.
|
| |||||||||||||||||||||||||||||||||||||||||||||||||||||||||||||||||||||||||||||||||||||||||||||||||||||||||||||
| Other | 23 | |||||||||||||||||||||||||||||||||||||||||||||||||||||||||||||||||||||||||||||||||||||||||||||||||||||||||||||
2002 - 2018 National Fire Incident Reporting System (NFIRS) incidents
- Incident types reported to NFIRS in Smithtown, NY
- 5,14350.6%Rescue & EMS
- 2,17521.4%False Alarm
- 1,29912.8%Hazardous Condition
- 6736.6%Fire
- 5185.1%Good Intent Call
- 3353.3%Service Call
- Fire incident types reported to NFIRS in Smithtown, NY
- 35953.3%Structure Fires
- 21531.9%Outside Fires
- 7310.8%Mobile Property/Vehicle Fires
- 263.9%Other
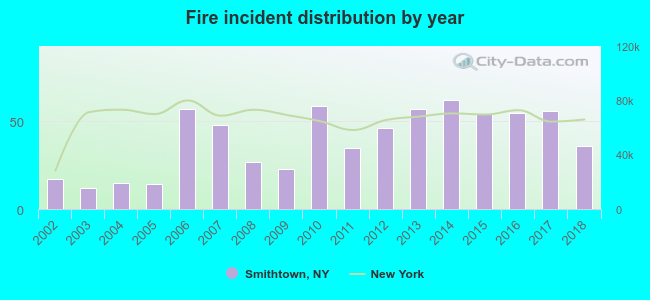 According to the data from the years 2002 - 2018 the average number of fires per year is 40. The highest number of fire incidents - 62 took place in 2014, and the least - 12 in 2003. The data has a growing trend.
The average number of yearly fire incidents per 10k residents in Smithtown, NY compared to nearest cities:
(Note: Based on data for the last 3 years, including only cities with population 5,000 and above)
| Smithtown: | 18.5 |
| Hauppauge: | 30.2 |
| Kings Park: | 10.6 |
| Nesconset: | 32.4 |
| Commack: | 5.4 |
| Central Islip: | 27.4 |
| Lake Grove: | 10.4 |
| Brentwood: | 21.8 |
| Ronkonkoma: | 43.0 |
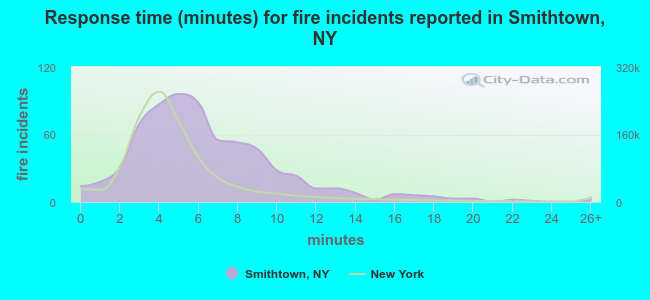 The median response time based on all reported fire incidents is 6 minutes. This is higher compared to the New York median value.
The median response time in Smithtown, NY compared to nearest cities:
(Note: Based on data for all years, including only cities with at least 500 fire incidents)
| Smithtown: | 6 minutes |
| Hauppauge: | 4 minutes |
| Commack: | 5 minutes |
| Central Islip: | 5 minutes |
| Brentwood: | 6 minutes |
| Ronkonkoma: | 6 minutes |
| Bohemia: | 4 minutes |
| Holbrook: | 4 minutes |
| Selden: | 4 minutes |
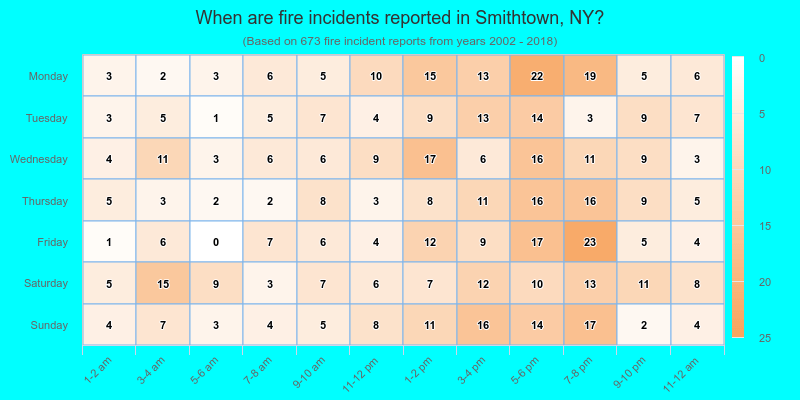
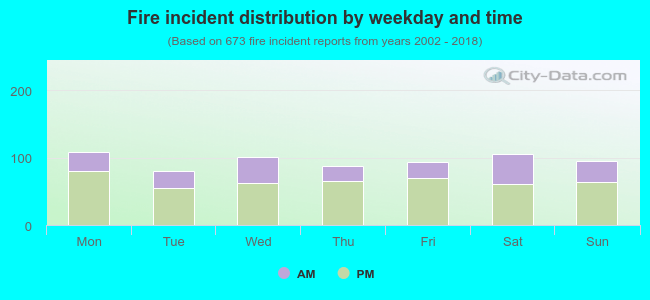 32.1% incidents where reported in the morning and 67.9% in the evening. The most fires (16.2%) took place on Monday, and the least (11.9%) on Tuesday.
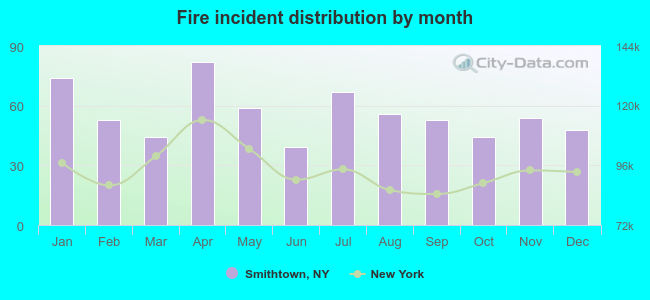 Based on the 673 incident reports from years 2002 - 2018 most fires (12.2%) took place during April, and the least (5.8%) in June.
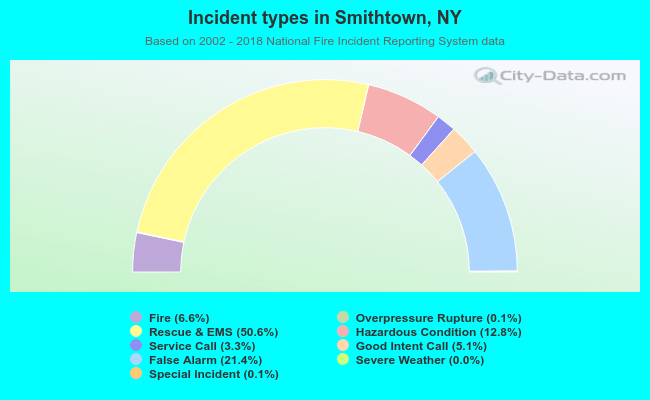 Out of all 10,165 cases reported during the years 2002 - 2018, the most belonged to the categories: Rescue & EMS (50.6%), False Alarm (21.4%), and Hazardous Condition (12.8%).
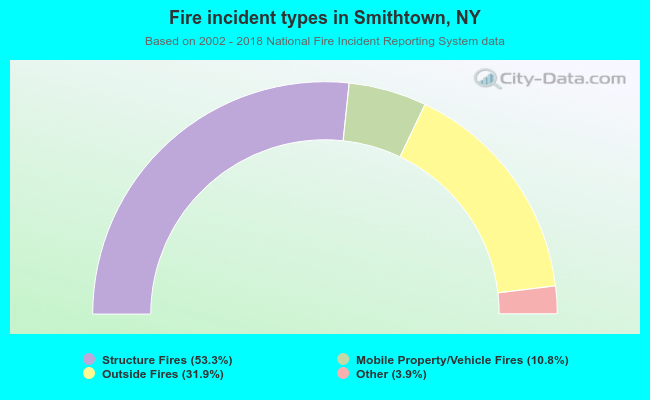 When looking into fire subcategories, the most incidents belonged to: Structure Fires (53.3%), and Outside Fires (31.9%).