South Bend: Fire Incidents, Indiana (IN)
Where are fire incidents reported in South Bend, IN
Something went wrong! Please refresh the page.
| Fire incidents reported | |
|---|---|
| Sreet name | Count |
| STATE ROAD 933 | 146 |
| QUINCE RD | 100 |
| CLEVELAND RD | 96 |
| SR 2 | 88 |
| WASHINGTON ST | 88 |
| MAYFLOWER RD | 86 |
| MICHIGAN ST | 84 |
| FILLMORE RD | 72 |
| CRUMSTOWN HWY | 70 |
| IRONWOOD RD | 70 |
| US 20 | 70 |
| EDISON RD | 66 |
| LINCOLN WAY W ST | 64 |
| ALONZO WATSON AVE | 62 |
| OAK RD | 58 |
| ARDMORE TRL | 54 |
| AUTEN RD | 54 |
| CRIPE STREET APARTMENTS | 54 |
| DIXIEWAY | 54 |
| ST JOSEPH ST | 54 |
| JOHNSON ST | 50 |
| ROOSEVELT RD | 50 |
| ADAMS RD | 48 |
| CALVERT ST | 48 |
| IRELAND RD | 48 |
| MAIN ST | 48 |
| SR 23 | 48 |
| BRICK RD | 46 |
| BROOKFIELD ST | 46 |
| KERN RD | 46 |
| Other | 2,970 |
2002 - 2017 National Fire Incident Reporting System (NFIRS) incidents
- Incident types reported to NFIRS in South Bend, IN
- 21,57954.8%Rescue & EMS
- 4,93812.5%Fire
- 4,06010.3%Hazardous Condition
- 3,95110.0%Good Intent Call
- 2,4146.1%Service Call
- 2,0565.2%False Alarm
- 3460.9%Special Incident
- Fire incident types reported to NFIRS in South Bend, IN
- 2,41849.0%Structure Fires
- 1,45329.4%Outside Fires
- 82816.8%Mobile Property/Vehicle Fires
- 2394.8%Other
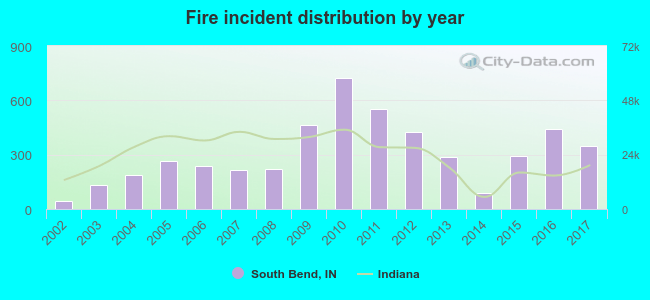 According to the data from the years 2002 - 2017 the average number of fires per year is 308. The highest number of fires - 722 took place in 2010, and the least - 43 in 2002. The data has a growing trend.
The average number of yearly fire incidents per 10k residents in South Bend, IN compared to nearest cities:
(Note: Based on data for the last 3 years, including only cities with population 5,000 and above)
| South Bend: | 26.3 |
| Notre Dame: | 36.8 |
| Mishawaka: | 21.9 |
| Granger: | 15.5 |
| Elkhart: | 14.4 |
| Nappanee: | 37.2 |
| Goshen: | 26.1 |
| Plymouth: | 24.4 |
| La Porte: | 21.5 |
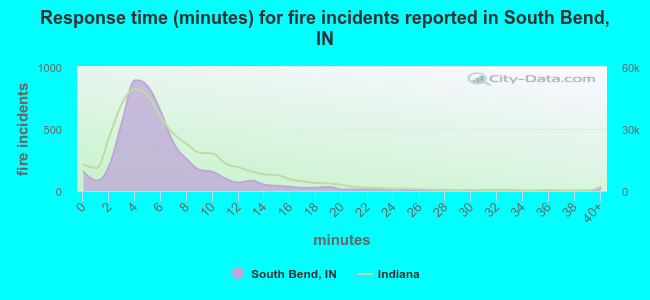 The median response time based on all reported fire incidents is 5 minutes. This is lower than the state median value.
The median response time in South Bend, IN compared to nearest cities:
(Note: Based on data for all years, including only cities with at least 500 fire incidents)
| South Bend: | 5 minutes |
| Notre Dame: | 2 minutes |
| Mishawaka: | 5 minutes |
| Granger: | 6 minutes |
| Osceola: | 9 minutes |
| Elkhart: | 6 minutes |
| Walkerton: | 8 minutes |
| Nappanee: | 6 minutes |
| Goshen: | 6 minutes |
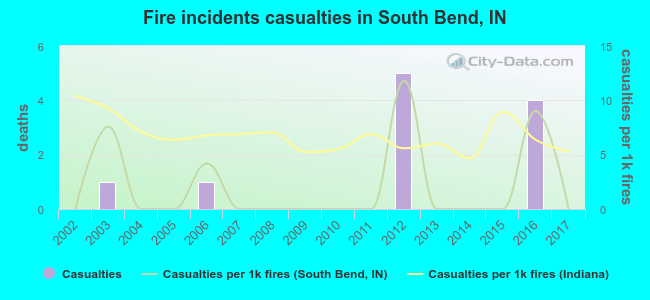 According to the reports from the years 2002 - 2017 the average number of fire-related yearly casualties is 1. The highest number of reported casualties - 5 took place in 2012, and the lowest - 0 in 2002. The data has a constant trend.
The average number of casualties per 1,000 fire incidents is 2. This indicator was the highest - 12 in 2012, and the lowest 0 in 2002. The trend for injuries per 1,000 fire incidents is constant. Compared to the Indiana value the number of injuries per 1,000 fires is much lower.
According to the reports from the years 2002 - 2017 the average number of fire-related yearly casualties is 1. The highest number of reported casualties - 5 took place in 2012, and the lowest - 0 in 2002. The data has a constant trend.
The average number of casualties per 1,000 fire incidents is 2. This indicator was the highest - 12 in 2012, and the lowest 0 in 2002. The trend for injuries per 1,000 fire incidents is constant. Compared to the Indiana value the number of injuries per 1,000 fires is much lower.
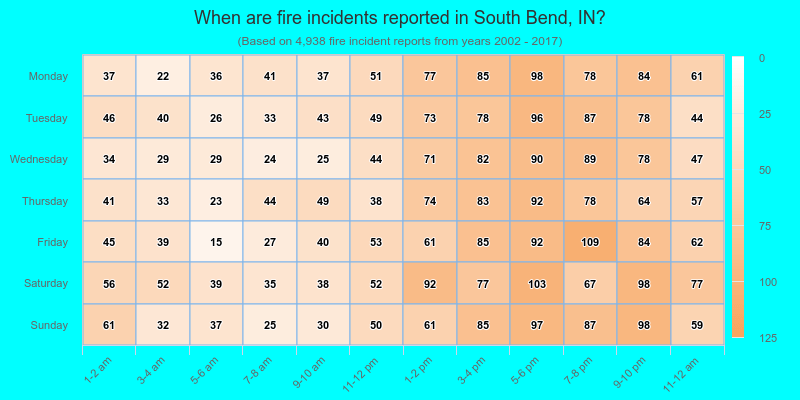
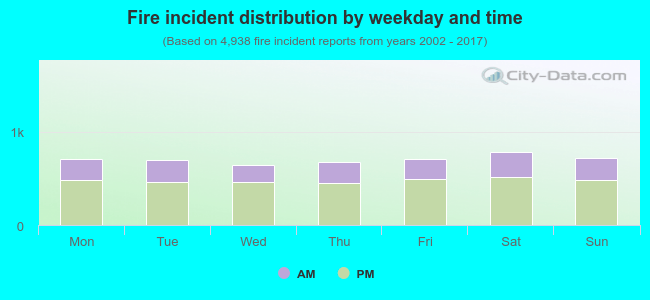 32.4% incidents where reported in the morning and 67.6% in the evening. The most fires (15.9%) took place on Saturday, and the least (13.0%) on Wednesday.
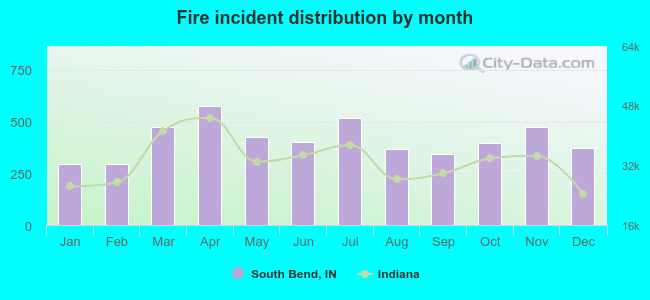 According to the 4,938 reports from years 2002 - 2017 most fires (11.7%) took place during April, and the least (6.0%) in February.
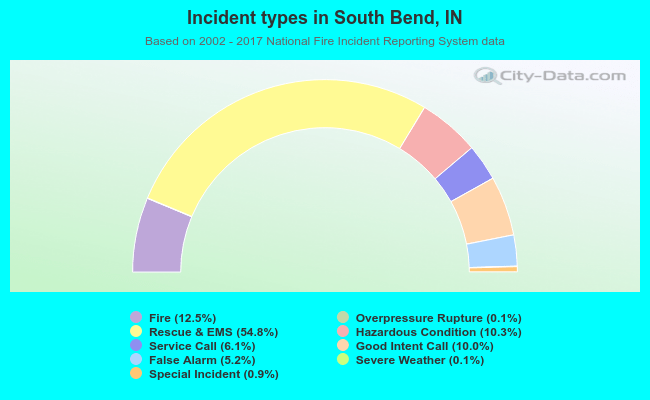 Out of all 39,400 cases reported during the years 2002 - 2017, the most belonged to the categories: Rescue & EMS (54.8%), Fire (12.5%), and Hazardous Condition (10.3%).
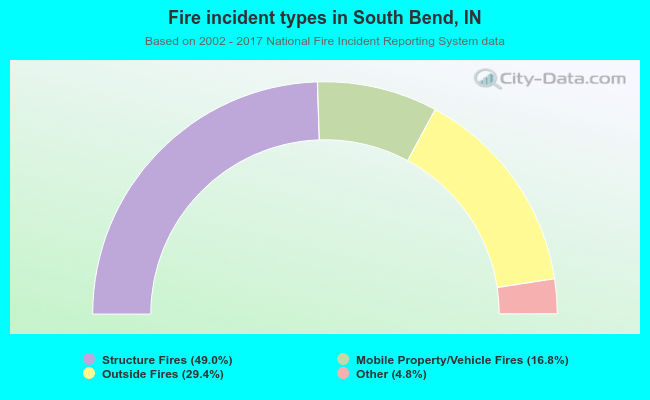 When looking into fire subcategories, the most reports belonged to: Structure Fires (49.0%), and Outside Fires (29.4%).