South Pasadena: Fire Incidents, California (CA)
Where are fire incidents reported in South Pasadena, CA
Something went wrong! Please refresh the page.
|
| |||||||||||||||||||||||||||||||||||||||||||||||||||||||||||||||||||||||||||||||||||||||||||||||||||||||||||||
2005 - 2018 National Fire Incident Reporting System (NFIRS) incidents
- Incident types reported to NFIRS in South Pasadena, CA
- 4,59054.4%Rescue & EMS
- 1,20014.2%Hazardous Condition
- 1,06812.7%Good Intent Call
- 6087.2%False Alarm
- 4905.8%Fire
- 4575.4%Service Call
- 110.1%Overpressure Rupture
- 90.1%Special Incident
- Fire incident types reported to NFIRS in South Pasadena, CA
- 24850.6%Structure Fires
- 12826.1%Outside Fires
- 7014.3%Mobile Property/Vehicle Fires
- 449.0%Other
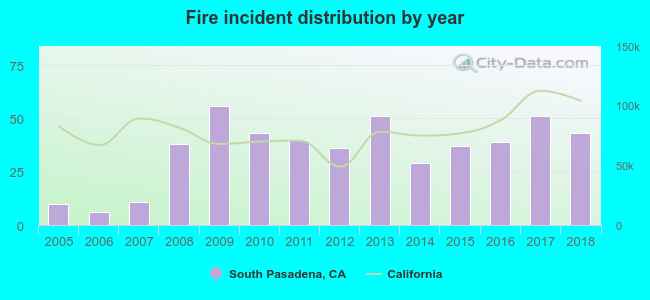 Based on the data from the years 2005 - 2018 the average number of fires per year is 35. The highest number of fires - 56 took place in 2009, and the least - 6 in 2006. The data has an increasing trend.
The average number of yearly fire incidents per 10k residents in South Pasadena, CA compared to nearest cities:
(Note: Based on data for the last 3 years, including only cities with population 5,000 and above)
| South Pasadena: | 16.9 |
| Alhambra: | 13.2 |
| San Marino: | 11.7 |
| Pasadena: | 20.6 |
| San Gabriel: | 15.8 |
| East San Gabriel: | 1.7 |
| Monterey Park: | 3.6 |
| Rosemead: | 13.7 |
| Altadena: | 15.2 |
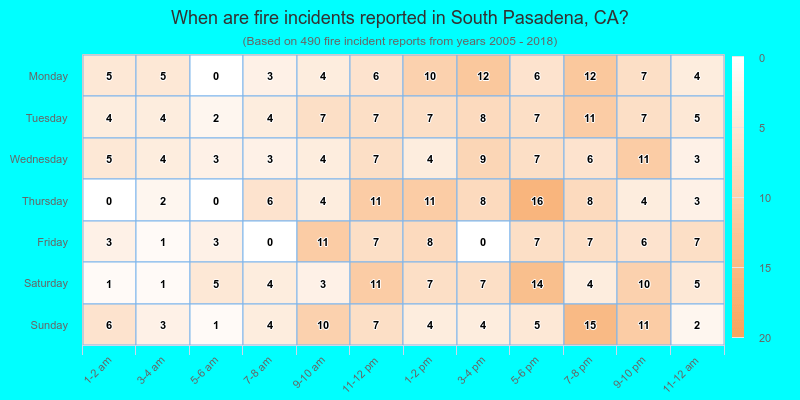
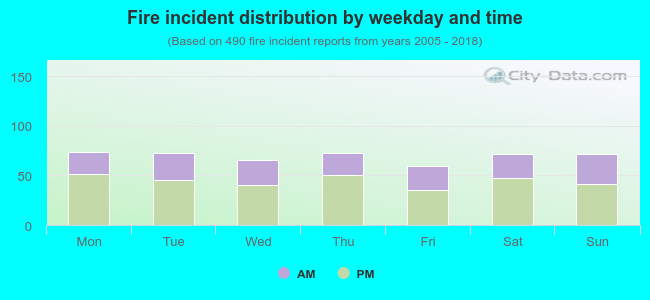 36.9% incidents where reported in the morning and 63.1% in the evening. The most fires (15.1%) took place on Monday, and the least (12.2%) on Friday.
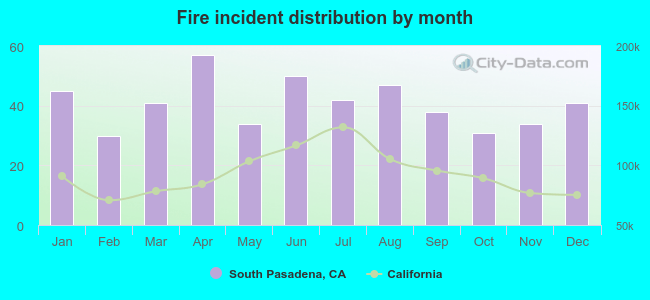 Based on the 490 fires from years 2005 - 2018 most fires (11.6%) took place during April, and the least (6.1%) in February.
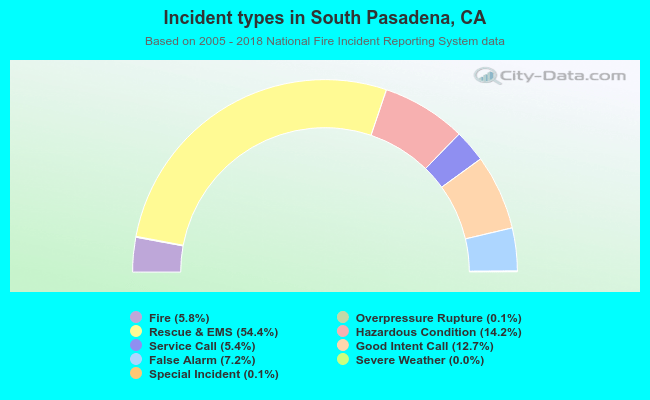 Out of all 8,435 cases reported during the years 2005 - 2018, the most belonged to the categories: Rescue & EMS (54.4%), Hazardous Condition (14.2%), and Good Intent Call (12.7%).
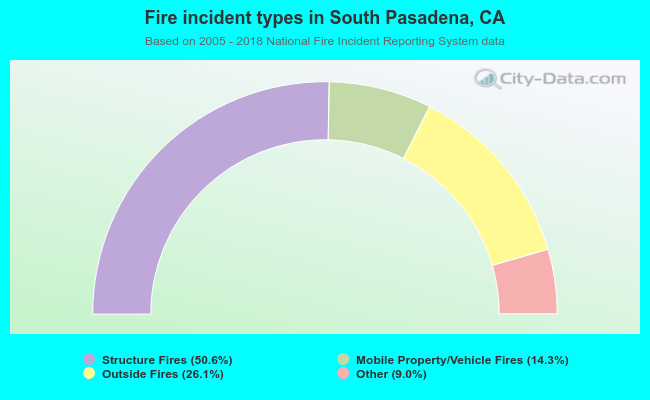 When looking into fire subcategories, the most incidents belonged to: Structure Fires (50.6%), and Outside Fires (26.1%).