Southport: Fire Incidents, Florida (FL)
Where are fire incidents reported in Southport, FL
Something went wrong! Please refresh the page.
|
| |||||||||||||||||||||||||||||||||||||||||||||||||||||||||||||||||||||||||||||||||||||||||||||||||||||||||||||
2006 - 2018 National Fire Incident Reporting System (NFIRS) incidents
- Incident types reported to NFIRS in Southport, FL
- 2,00657.0%Rescue & EMS
- 43012.2%Service Call
- 37810.7%Fire
- 3239.2%Good Intent Call
- 2376.7%Hazardous Condition
- 842.4%False Alarm
- 541.5%Special Incident
- 70.2%Severe Weather
- Fire incident types reported to NFIRS in Southport, FL
- 16944.7%Outside Fires
- 13836.5%Structure Fires
- 6015.9%Mobile Property/Vehicle Fires
- 112.9%Other
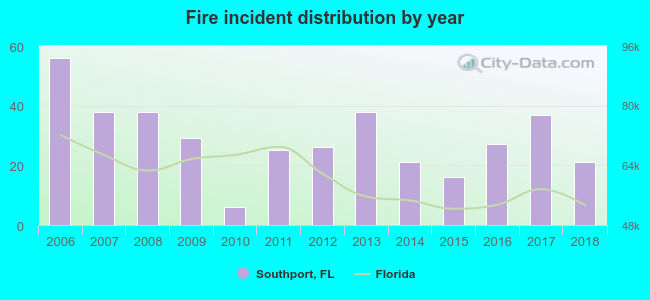 Based on the data from the years 2006 - 2018 the average number of fires per year is 29. The highest number of fire incidents - 56 took place in 2006, and the least - 6 in 2010. The data has a declining trend.
The average number of yearly fire incidents per 10k residents in Southport, FL compared to nearest cities:
(Note: Based on data for the last 3 years, including only cities with population 5,000 and above)
| Southport: | 32.9 |
| Lynn Haven: | 21.9 |
| Panama City Beach: | 135.7 |
| Panama City Beaches: | 1.0 |
| Panama City: | 49.7 |
| Springfield: | 32.8 |
| Youngstown: | 35.9 |
| Callaway: | 50.9 |
| Miramar Beach: | 52.1 |
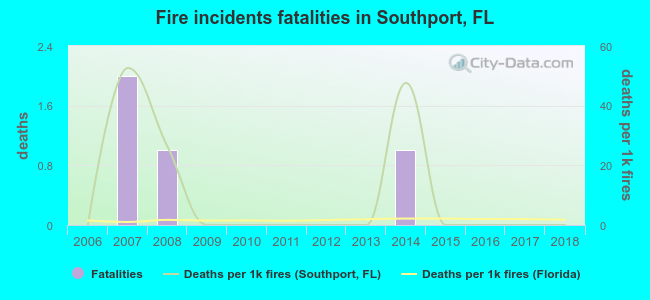 Based on the data from the years 2006 - 2018 the average number of fire-related fatalities per year is 0. The highest number of reported deaths - 2 took place in 2007, and the lowest - 0 in 2006. The data has a constant trend.
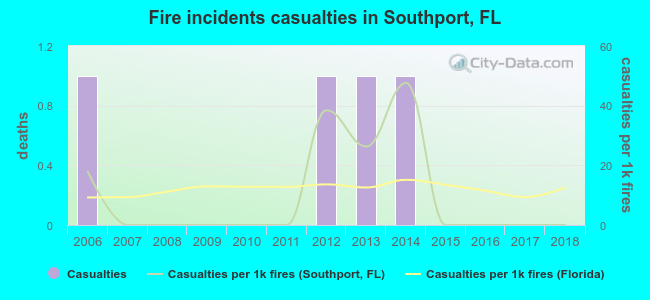 According to the reports from the years 2006 - 2018 the average number of fire-related yearly casualties is 0. The highest number of reported injuries - 1 took place in 2006, and the lowest - 0 in 2007. The data has a declining trend.
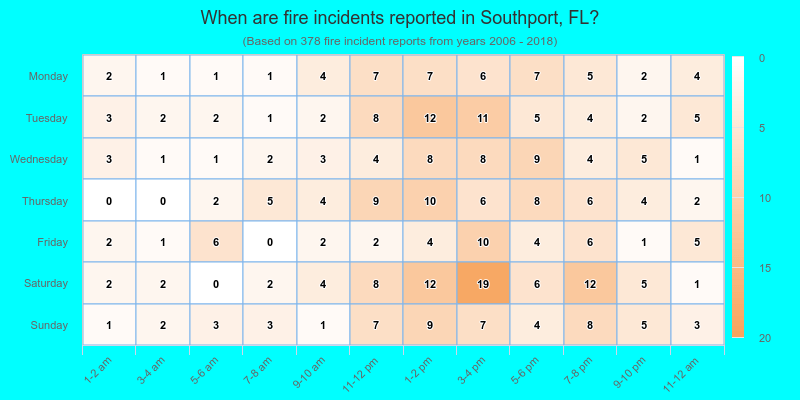
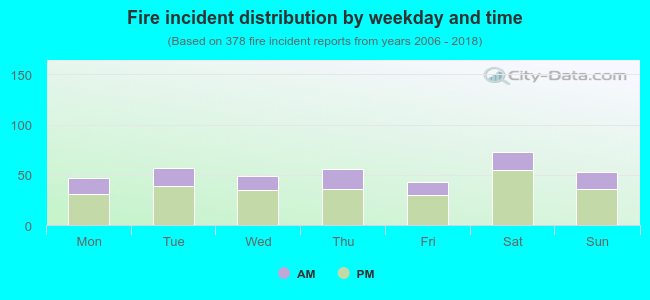 30.7% incidents where reported in the morning and 69.3% in the evening. The most fires (19.3%) took place on Saturday, and the least (11.4%) on Friday.
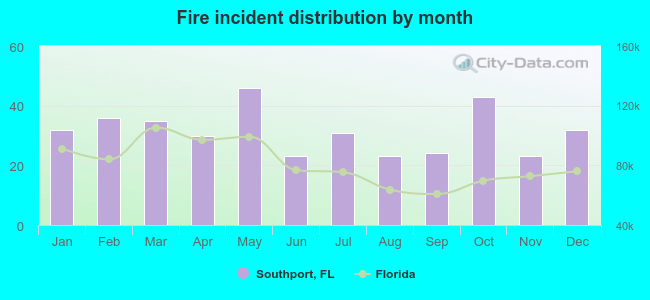 According to the 378 fire incident reports from years 2006 - 2018 most fires (12.2%) took place during May, and the least (6.1%) in June.
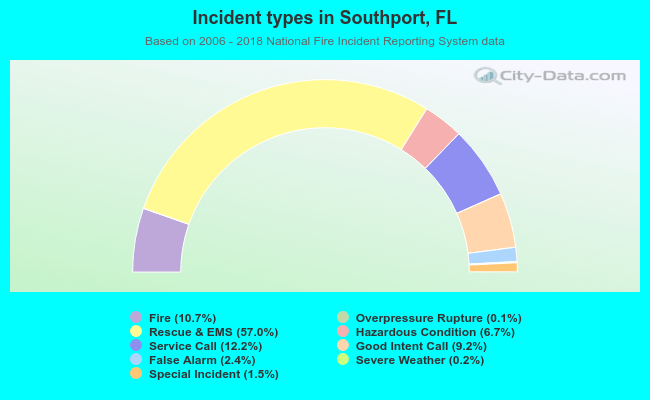 Out of all 3,521 cases reported during the years 2006 - 2018, the most belonged to the categories: Rescue & EMS (57.0%), Service Call (12.2%), and Fire (10.7%).
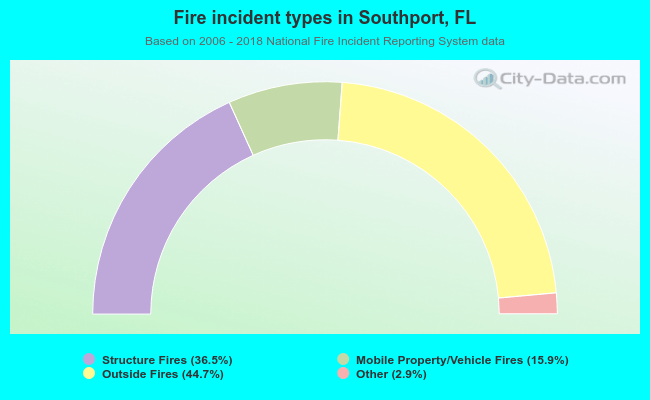 When looking into fire subcategories, the most reports belonged to: Outside Fires (44.7%), and Structure Fires (36.5%).