Sparta: Fire Incidents, Michigan (MI)
Where are fire incidents reported in Sparta, MI
Something went wrong! Please refresh the page.
|
| |||||||||||||||||||||||||||||||||||||||||||||||||||||||||||||||||||||||||||||||||||||||||||||||||||||||||||||
2002 - 2018 National Fire Incident Reporting System (NFIRS) incidents
- Incident types reported to NFIRS in Sparta, MI
- 4,34064.0%Rescue & EMS
- 69810.3%Fire
- 6269.2%Hazardous Condition
- 5217.7%Good Intent Call
- 4246.3%Service Call
- 1552.3%False Alarm
- 140.2%Special Incident
- Fire incident types reported to NFIRS in Sparta, MI
- 36552.3%Structure Fires
- 17324.8%Outside Fires
- 10214.6%Mobile Property/Vehicle Fires
- 588.3%Other
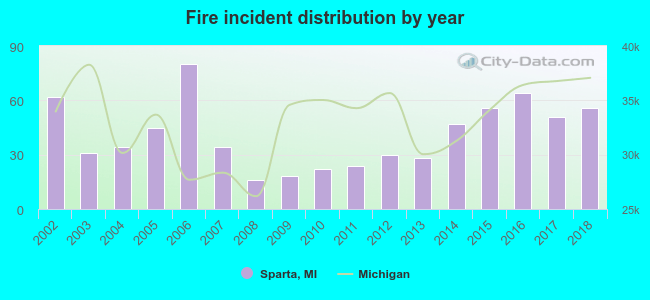 According to the data from the years 2002 - 2018 the average number of fire incidents per year is 41. The highest number of fires - 80 took place in 2006, and the least - 16 in 2008. The data has a decreasing trend.
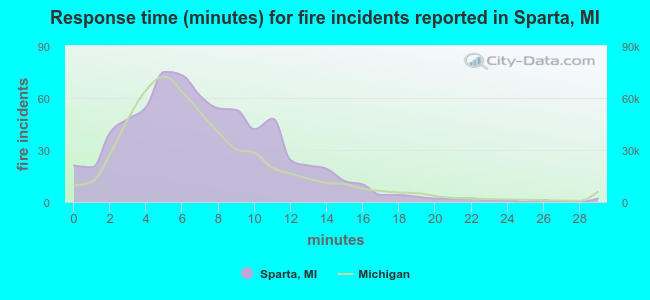 The median response time based on all reported fire incidents is 7 minutes. This is similar to the state median value.
The median response time in Sparta, MI compared to nearest cities:
(Note: Based on data for all years, including only cities with at least 500 fire incidents)
| Sparta: | 7 minutes |
| Rockford: | 6 minutes |
| Comstock Park: | 7 minutes |
| Cedar Springs: | 7 minutes |
| Walker: | 9 minutes |
| Coopersville: | 8 minutes |
| Grant: | 10 minutes |
| Grand Rapids: | 5 minutes |
| Allendale: | 8 minutes |
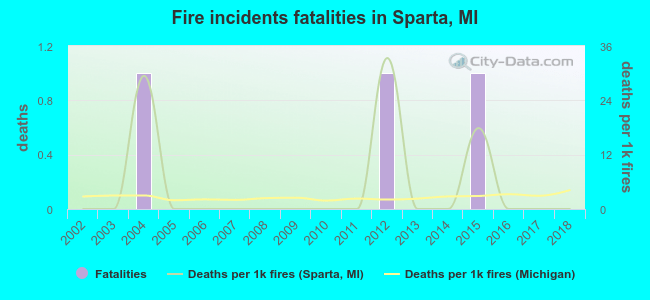 According to the data from the years 2002 - 2018 the average number of fire-related fatalities per year is 0. The highest number of deaths - 1 took place in 2004, and the lowest - 0 in 2002. The data has a constant trend.
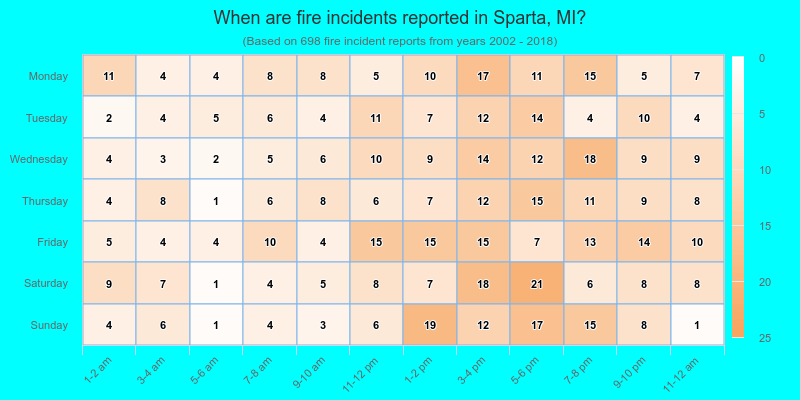
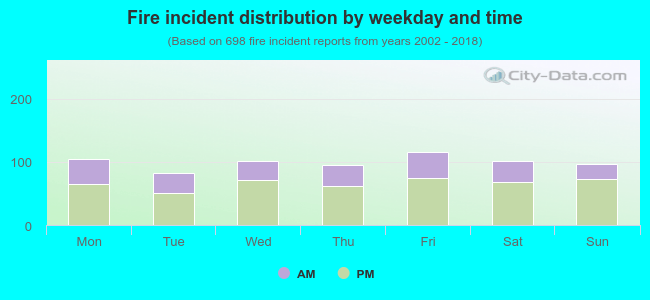 33.7% incidents where reported in the morning and 66.3% in the evening. The most fires (16.6%) took place on Friday, and the least (11.9%) on Tuesday.
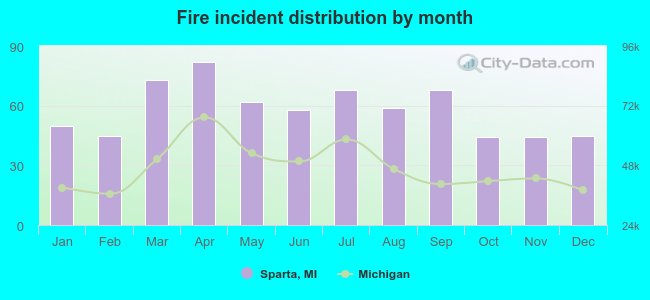 According to the 698 reports from years 2002 - 2018 most fires (11.7%) took place during April, and the least (6.3%) in October.
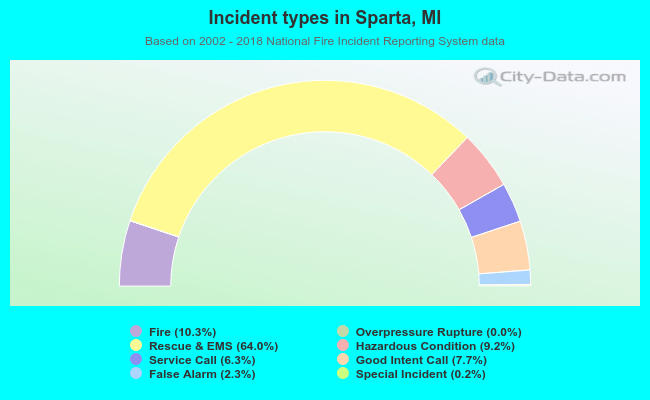 Out of all 6,780 cases reported during the years 2002 - 2018, the most belonged to the categories: Rescue & EMS (64.0%), Fire (10.3%), and Hazardous Condition (9.2%).
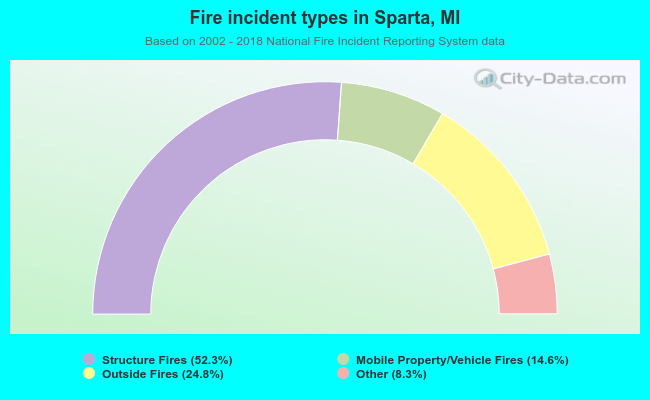 When looking into fire subcategories, the most reports belonged to: Structure Fires (52.3%), and Outside Fires (24.8%).