Spicer: Fire Incidents, Minnesota (MN)
Where are fire incidents reported in Spicer, MN
Something went wrong! Please refresh the page.
|
| |||||||||||||||||||||||||||||||||||||||||||||||||||||||||||||||||||||||||||||||||||||||||||||||||||||||||||||
2002 - 2018 National Fire Incident Reporting System (NFIRS) incidents
- Incident types reported to NFIRS in Spicer, MN
- 19747.6%Fire
- 6315.2%False Alarm
- 6114.7%Hazardous Condition
- 358.5%Severe Weather
- 317.5%Rescue & EMS
- 102.4%Good Intent Call
- 81.9%Service Call
- 71.7%Special Incident
- 20.5%Overpressure Rupture
- Fire incident types reported to NFIRS in Spicer, MN
- 9749.2%Structure Fires
- 5829.4%Outside Fires
- 3316.8%Mobile Property/Vehicle Fires
- 94.6%Other
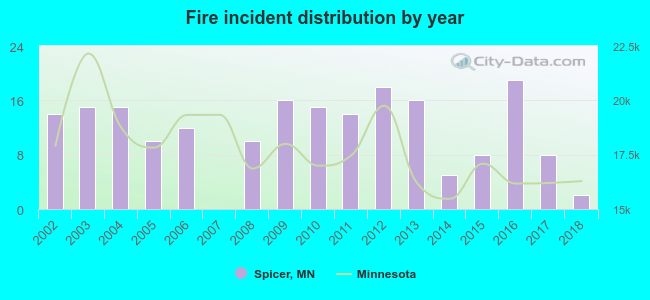 According to the data from the years 2002 - 2018 the average number of fire incidents per year is 12. The highest number of reported fires - 19 took place in 2016, and the least - 0 in 2007. The data has a decreasing trend.
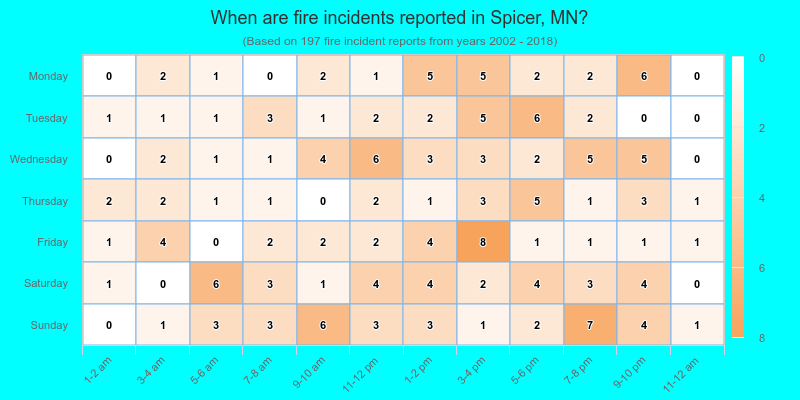
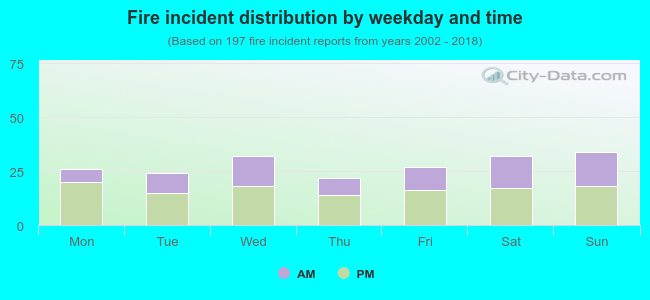 40.1% incidents where reported in the morning and 59.9% in the evening. The most fires (17.3%) took place on Sunday, and the least (11.2%) on Thursday.
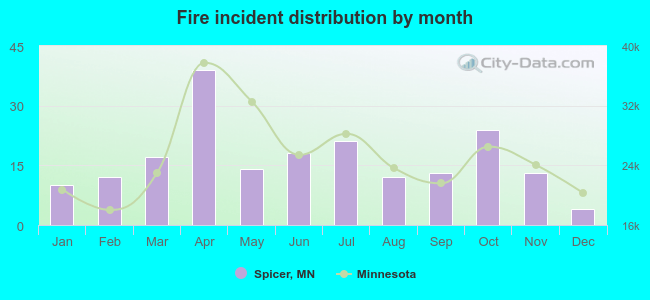 Based on the 197 incident reports from years 2002 - 2018 most fires (19.8%) took place during April, and the least (2.0%) in December.
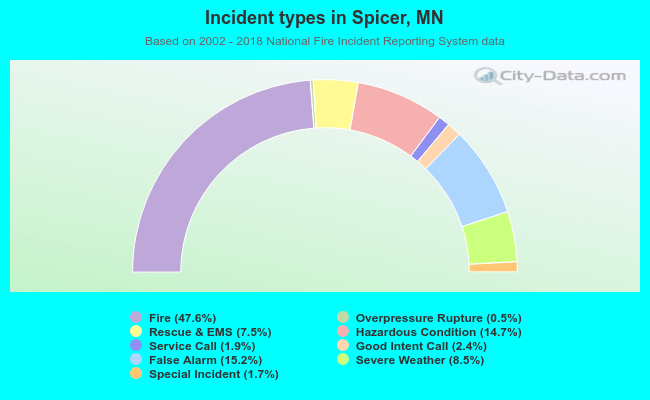 Out of all 414 cases reported during the years 2002 - 2018, the most belonged to the categories: Fire (47.6%), False Alarm (15.2%), and Hazardous Condition (14.7%).
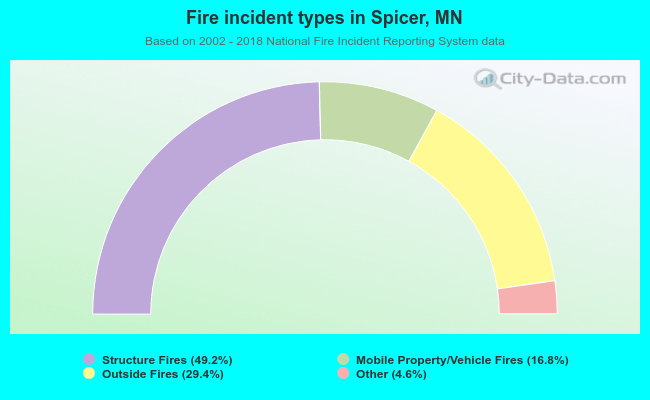 When looking into fire subcategories, the most incidents belonged to: Structure Fires (49.2%), and Outside Fires (29.4%).