Springfield: Fire Incidents, Florida (FL)
Where are fire incidents reported in Springfield, FL
Something went wrong! Please refresh the page.
| Fire incidents reported | |
|---|---|
| Sreet name | Count |
| TRANSMITTER RD | 126 |
| 11TH ST | 64 |
| SCHOOL AVE | 58 |
| EVERITT AVE | 50 |
| 2ND ST | 26 |
| CLAIRE AVE | 24 |
| DETROIT AVE | 24 |
| HELEN AVE | 24 |
| LANE RD | 24 |
| SPRINGFIELD AVE | 24 |
| 7TH ST | 22 |
| BUS 98 HWY | 22 |
| FLIGHT AVE | 22 |
| HARLEM AVE | 22 |
| TYNDALL PKY | 22 |
| 3RD ST | 20 |
| 6TH PLZ | 20 |
| CENTRAL AVE | 20 |
| CHERRY ST | 20 |
| 14TH ST | 18 |
| 15TH ST | 18 |
| 4TH ST | 18 |
| 8TH ST | 16 |
| SANDERS LN | 16 |
| TEN ACRE RD | 16 |
| 11 TH ST | 14 |
| 9TH ST | 14 |
| BOB LITTLE RD | 14 |
| BUSINESS 98 HWY | 14 |
| RUSS LAKE DR | 14 |
| Other | 3 |
2002 - 2018 National Fire Incident Reporting System (NFIRS) incidents
- Incident types reported to NFIRS in Springfield, FL
- 5,09064.9%Rescue & EMS
- 80910.3%Fire
- 7459.5%Service Call
- 4605.9%Hazardous Condition
- 4475.7%Good Intent Call
- 2072.6%False Alarm
- 570.7%Special Incident
- 180.2%Severe Weather
- Fire incident types reported to NFIRS in Springfield, FL
- 40850.4%Structure Fires
- 21326.3%Outside Fires
- 13416.6%Mobile Property/Vehicle Fires
- 546.7%Other
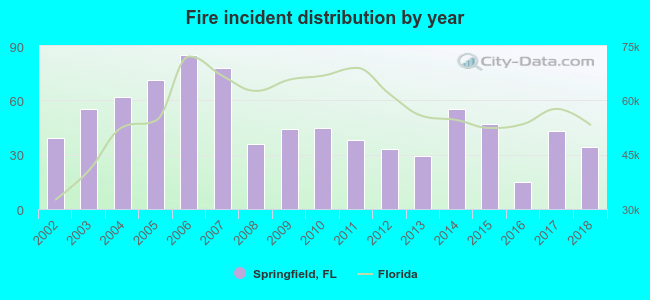 Based on the data from the years 2002 - 2018 the average number of fire incidents per year is 48. The highest number of fires - 85 took place in 2006, and the least - 15 in 2016. The data has a dropping trend.
The average number of yearly fire incidents per 10k residents in Springfield, FL compared to nearest cities:
(Note: Based on data for the last 3 years, including only cities with population 5,000 and above)
| Springfield: | 32.8 |
| Callaway: | 50.9 |
| Panama City: | 49.7 |
| Lynn Haven: | 21.9 |
| Panama City Beaches: | 1.0 |
| Panama City Beach: | 135.7 |
| Southport: | 32.9 |
| Youngstown: | 35.9 |
| Miramar Beach: | 52.1 |
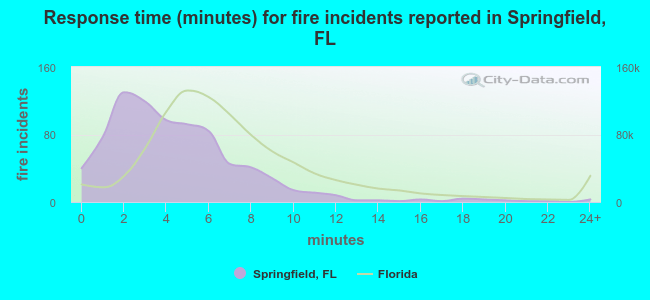 The median response time based on all reported fire incidents is 4 minutes. This is lower than the state median value.
The median response time in Springfield, FL compared to nearest cities:
(Note: Based on data for all years, including only cities with at least 500 fire incidents)
| Springfield: | 4 minutes |
| Callaway: | 5 minutes |
| Panama City: | 4 minutes |
| Lynn Haven: | 3 minutes |
| Panama City Beach: | 4 minutes |
| Freeport: | 8 minutes |
| Blountstown: | 4 minutes |
| Chipley: | 10 minutes |
| Bonifay: | 8 minutes |
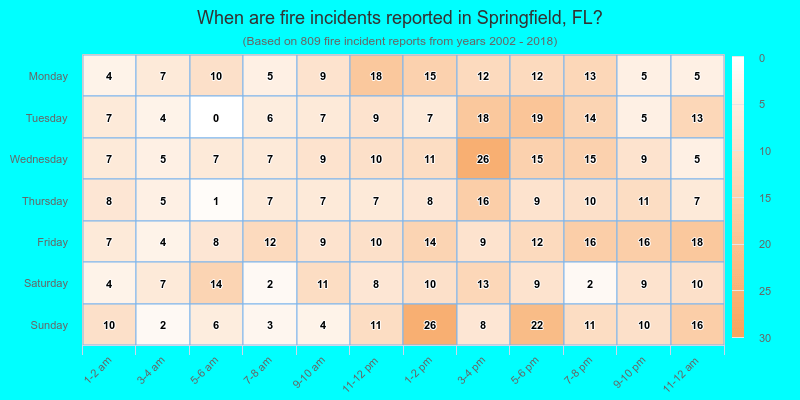
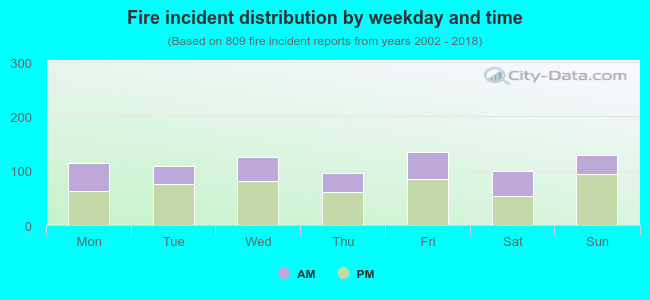 36.8% incidents where reported in the morning and 63.2% in the evening. The most fires (16.7%) took place on Friday, and the least (11.9%) on Thursday.
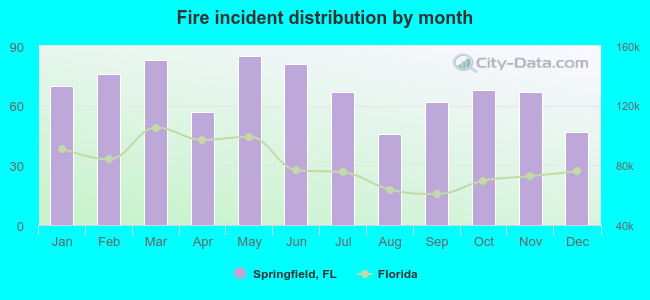 According to the 809 fires from years 2002 - 2018 most fires (10.5%) took place during May, and the least (5.7%) in August.
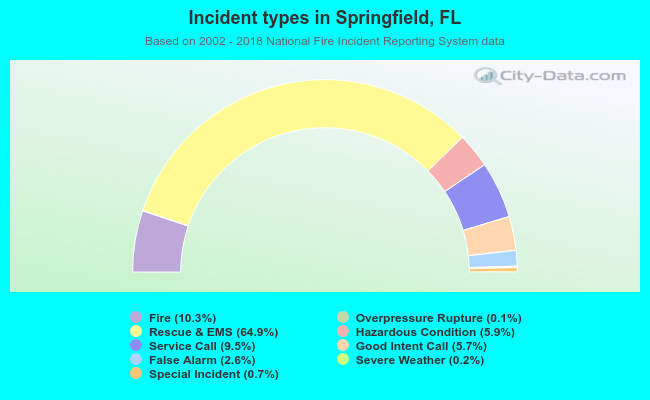 Out of all 7,839 cases reported during the years 2002 - 2018, the most belonged to the categories: Rescue & EMS (64.9%), Fire (10.3%), and Service Call (9.5%).
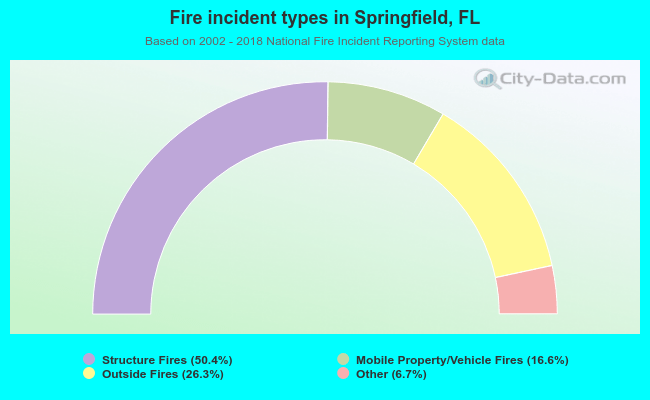 When looking into fire subcategories, the most reports belonged to: Structure Fires (50.4%), and Outside Fires (26.3%).