Springfield: Fire Incidents, Massachusetts (MA)
Where are fire incidents reported in Springfield, MA
Something went wrong! Please refresh the page.
| Fire incidents reported | |
|---|---|
| Sreet name | Count |
| MAIN ST | 978 |
| CHESTNUT ST | 942 |
| STATE ST | 764 |
| BELMONT AVE | 612 |
| BOSTON RD | 600 |
| WILBRAHAM RD | 490 |
| OAK GROVE AVE | 470 |
| WORTHINGTON ST | 454 |
| LIBERTY ST | 446 |
| ROOSEVELT AVE | 424 |
| UNION ST | 416 |
| SUMNER AVE | 396 |
| CAREW ST | 368 |
| CENTRAL ST | 328 |
| DWIGHT ST | 318 |
| BAY ST | 290 |
| HANCOCK ST | 288 |
| WALNUT ST | 266 |
| MAPLE ST | 260 |
| ST JAMES AVE | 258 |
| ALLEN ST | 238 |
| PINE ST | 238 |
| ARMORY ST | 224 |
| HIGH ST | 212 |
| LONGHILL ST | 208 |
| MILL ST | 196 |
| SAAB CT | 190 |
| WHITE ST | 186 |
| PAGE BLVD | 184 |
| DICKINSON ST | 182 |
| Other | 4,418 |
2002 - 2018 National Fire Incident Reporting System (NFIRS) incidents
- Incident types reported to NFIRS in Springfield, MA
- 38,71940.6%Rescue & EMS
- 15,84416.6%Fire
- 13,88414.6%False Alarm
- 11,19611.7%Good Intent Call
- 9,4349.9%Hazardous Condition
- 5,9446.2%Service Call
- 2670.3%Overpressure Rupture
- Fire incident types reported to NFIRS in Springfield, MA
- 8,87456.0%Structure Fires
- 4,59429.0%Outside Fires
- 1,84911.7%Mobile Property/Vehicle Fires
- 5273.3%Other
 According to the data from the years 2002 - 2018 the average number of fire incidents per year is 932. The highest number of reported fires - 1,335 took place in 2007, and the least - 471 in 2018. The data has a decreasing trend.
The average number of yearly fire incidents per 10k residents in Springfield, MA compared to nearest cities:
(Note: Based on data for the last 3 years, including only cities with population 5,000 and above)
| Springfield: | 37.6 |
| East Longmeadow: | 30.1 |
| Longmeadow: | 20.9 |
| Chicopee: | 33.0 |
| West Springfield: | 30.4 |
| Agawam: | 26.7 |
| Ludlow: | 30.6 |
| Holyoke: | 90.1 |
| Hampden: | 92.8 |
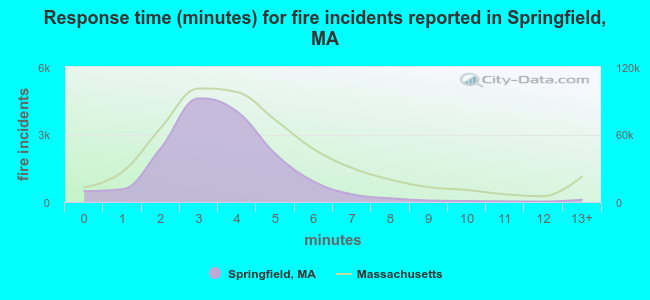 The median response time based on all reported fire incidents is 3 minutes. This is lower than the state median value.
The median response time in Springfield, MA compared to nearest cities:
(Note: Based on data for all years, including only cities with at least 500 fire incidents)
| Springfield: | 3 minutes |
| East Longmeadow: | 5 minutes |
| Longmeadow: | 6 minutes |
| Chicopee: | 4 minutes |
| West Springfield: | 3 minutes |
| Agawam: | 4 minutes |
| Ludlow: | 4 minutes |
| Wilbraham: | 6 minutes |
| Holyoke: | 4 minutes |
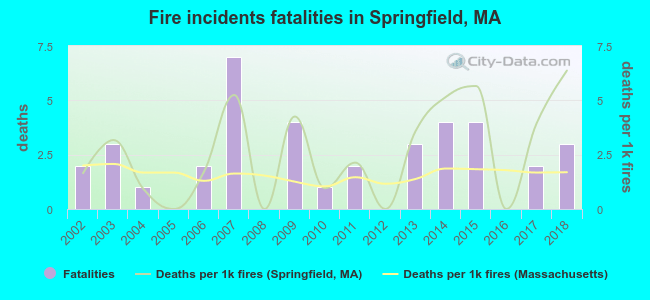 Based on the reports from the years 2002 - 2018 the average number of fire-related fatalities per year is 2. The highest number of deaths - 7 took place in 2007, and the lowest - 0 in 2005. The data has a rising trend.
The average number of deaths per 1,000 fire incidents is 3. This indicator was the highest - 6 in 2018, and the lowest 0 in 2005. The trend for fatalities per 1,000 fire incidents is rising. Compared to the state value the number of deaths per 1,000 fire incidents is higher.
Based on the reports from the years 2002 - 2018 the average number of fire-related fatalities per year is 2. The highest number of deaths - 7 took place in 2007, and the lowest - 0 in 2005. The data has a rising trend.
The average number of deaths per 1,000 fire incidents is 3. This indicator was the highest - 6 in 2018, and the lowest 0 in 2005. The trend for fatalities per 1,000 fire incidents is rising. Compared to the state value the number of deaths per 1,000 fire incidents is higher.
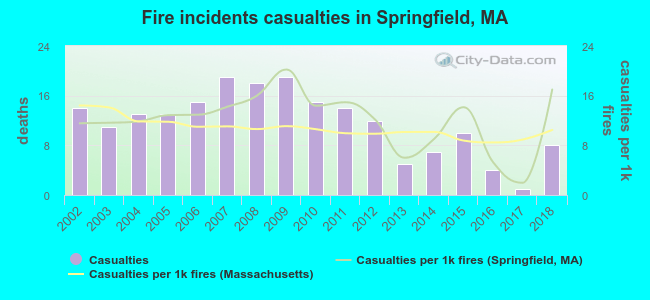 Based on the data from the years 2002 - 2018 the average number of fire-related yearly casualties is 12. The highest number of injuries - 19 took place in 2007, and the lowest - 1 in 2017. The data has a declining trend.
The average number of casualties per 1,000 fires is 12. This indicator was the highest - 20 in 2009, and the lowest 2 in 2017. The trend for casualties per 1,000 fires is increasing. Compared to the Massachusetts value the number of injuries per 1,000 fires is similar.
Based on the data from the years 2002 - 2018 the average number of fire-related yearly casualties is 12. The highest number of injuries - 19 took place in 2007, and the lowest - 1 in 2017. The data has a declining trend.
The average number of casualties per 1,000 fires is 12. This indicator was the highest - 20 in 2009, and the lowest 2 in 2017. The trend for casualties per 1,000 fires is increasing. Compared to the Massachusetts value the number of injuries per 1,000 fires is similar.Casualties per 1,000 incidents in Springfield, MA compared to nearest cities:
(Note: Based on data for all years, including only cities with at least 500 fire incidents)
| Springfield: | 12.5 |
| East Longmeadow: | 23.8 |
| Longmeadow: | 12.1 |
| Chicopee: | 30.2 |
| West Springfield: | 23.9 |
| Agawam: | 29.0 |
| Ludlow: | 22.3 |
| Wilbraham: | 22.3 |
| Holyoke: | 8.8 |
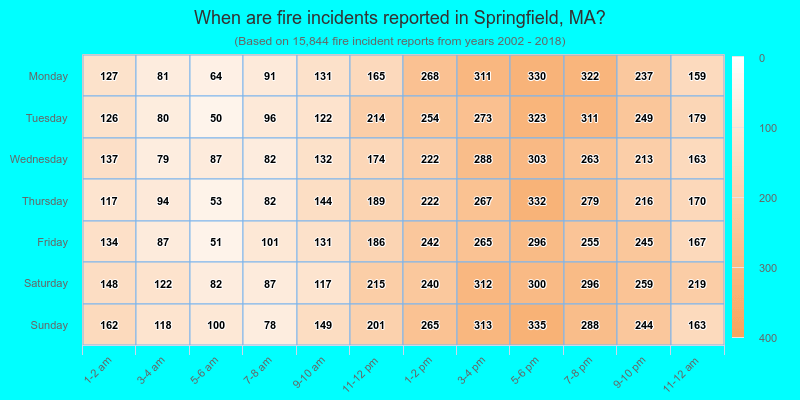
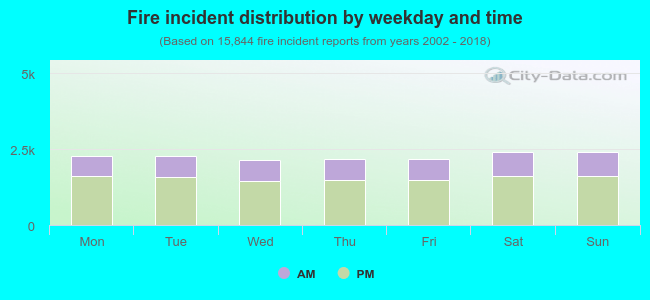 31.5% incidents where reported in the morning and 68.5% in the evening. The most fires (15.2%) took place on Sunday, and the least (13.5%) on Wednesday.
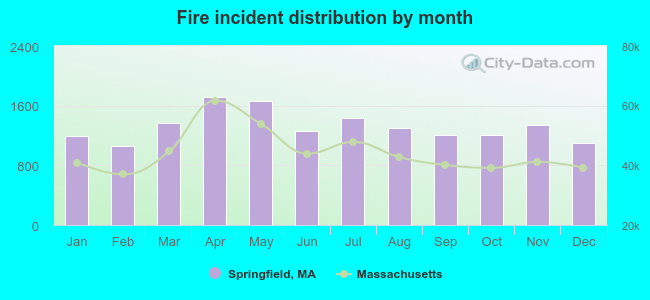 Based on the 15,844 fire incidents from years 2002 - 2018 most fires (10.8%) took place during April, and the least (6.7%) in February.
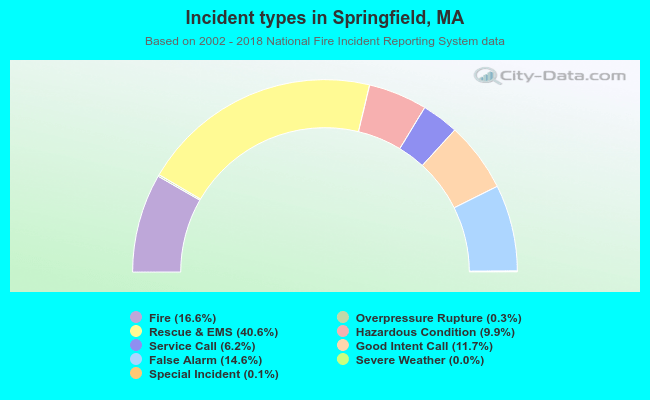 Out of all 95,398 cases reported during the years 2002 - 2018, the most belonged to the categories: Rescue & EMS (40.6%), Fire (16.6%), and False Alarm (14.6%).
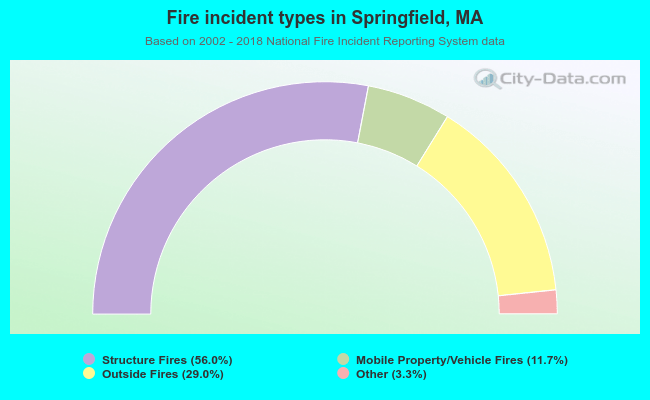 When looking into fire subcategories, the most reports belonged to: Structure Fires (56.0%), and Outside Fires (29.0%).