Stockton: Fire Incidents, Kansas (KS)
Where are fire incidents reported in Stockton, KS
Something went wrong! Please refresh the page.
|
| |||||||||||||||||||||||||||||||||||||||||||||||||||||||||||||||||||||||||||||||||||||||||||||||||||||||||||||
| Other | 11 | |||||||||||||||||||||||||||||||||||||||||||||||||||||||||||||||||||||||||||||||||||||||||||||||||||||||||||||
2002 - 2017 National Fire Incident Reporting System (NFIRS) incidents
- Incident types reported to NFIRS in Stockton, KS
- 32194.1%Fire
- 113.2%Hazardous Condition
- 92.6%Good Intent Call
- Fire incident types reported to NFIRS in Stockton, KS
- 14846.1%Outside Fires
- 11234.9%Other
- 4112.8%Structure Fires
- 206.2%Mobile Property/Vehicle Fires
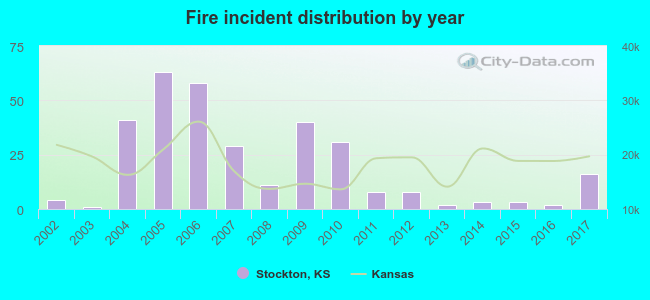 Based on the data from the years 2002 - 2017 the average number of fires per year is 20. The highest number of fires - 63 took place in 2005, and the least - 1 in 2003. The data has a growing trend.
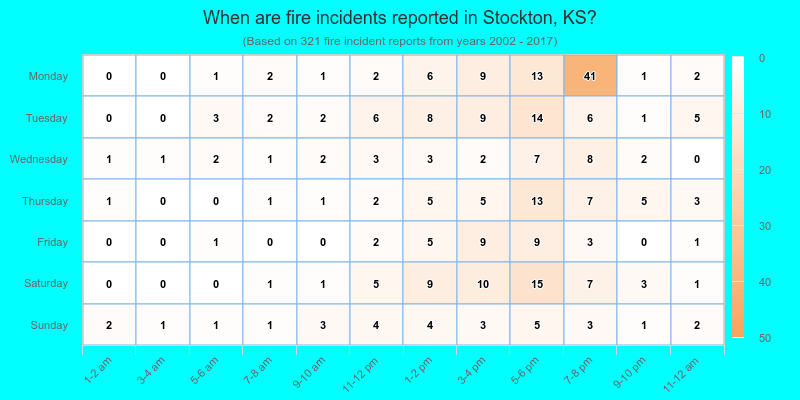
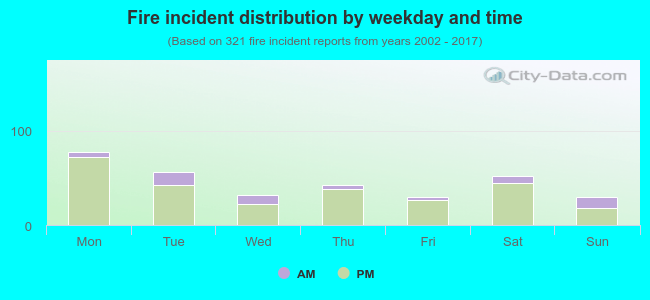 17.4% incidents where reported in the morning and 82.6% in the evening. The most fires (24.3%) took place on Monday, and the least (9.3%) on Friday.
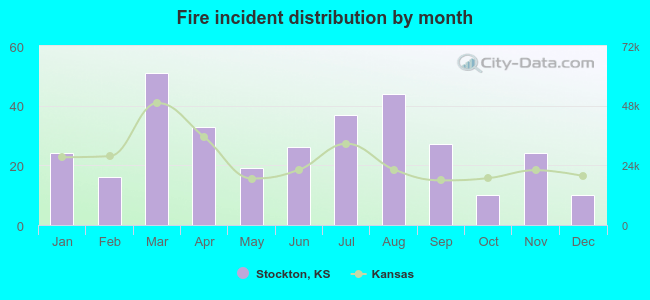 Based on the 321 reports from years 2002 - 2017 most fires (15.9%) took place during March, and the least (3.1%) in October.
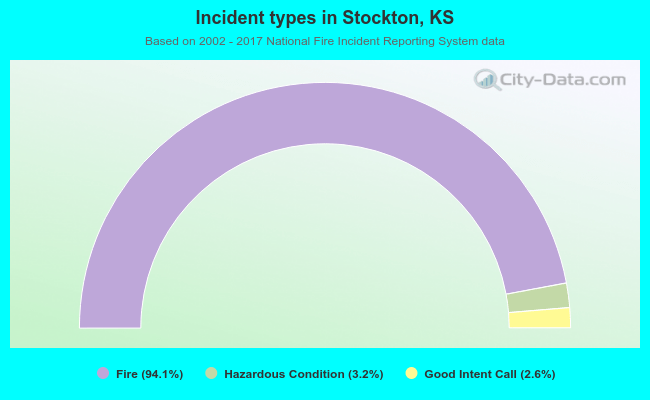 Out of all 341 cases reported during the years 2002 - 2017, the most belonged to the categories: Fire (94.1%), Overpressure Rupture (3.2%), and Rescue & EMS (2.6%).
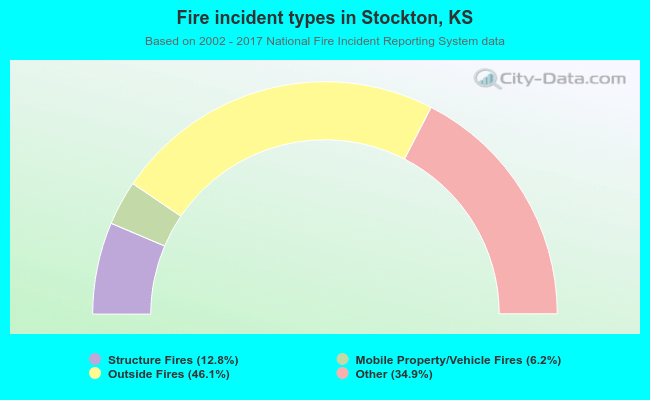 When looking into fire subcategories, the most incidents belonged to: Outside Fires (46.1%), and Other (34.9%).