Stuarts Draft: Fire Incidents, Virginia (VA)
Where are fire incidents reported in Stuarts Draft, VA
Something went wrong! Please refresh the page.
| Fire incidents reported | |
|---|---|
| Sreet name | Count |
| STUARTS DRAFT HWY | 164 |
| COLD SPRINGS RD | 98 |
| HOWARDSVILLE TPKE | 88 |
| HOWARDSVILLE TPKE | 52 |
| PATTON FARM RD | 50 |
| WILDA RD | 50 |
| LYNDHURST RD | 48 |
| OLD CIDER MILL LN | 46 |
| DODGE ST | 40 |
| FOREST SPRINGS DR | 38 |
| HAROLD COOK DR | 38 |
| TWIN HILL RD | 38 |
| MULLINS LN | 34 |
| GERTIES LN | 32 |
| OLD WHITE HILL RD | 26 |
| TINKLING SPRING RD | 26 |
| WAYNE AVE | 26 |
| CHURCHMANS MILL RD | 24 |
| DRAFT AVE | 24 |
| GUTHRIE RD | 24 |
| LAKE RD | 24 |
| AUGUSTA FARMS RD | 22 |
| BERRY PATCH LN | 20 |
| COOPER DR | 20 |
| COURTNEY WOODS LN | 20 |
| RANKIN LN | 20 |
| CHINA CLAY RD | 18 |
| BRITTANY LN | 16 |
| CAMBRIDGE DR | 16 |
| FLINT MOUNTAIN DR | 16 |
2002 - 2018 National Fire Incident Reporting System (NFIRS) incidents
- Incident types reported to NFIRS in Stuarts Draft, VA
- 1,34728.1%Rescue & EMS
- 1,08222.5%Good Intent Call
- 97220.2%Fire
- 82417.2%Hazardous Condition
- 2565.3%Service Call
- 2194.6%False Alarm
- 761.6%Severe Weather
- 140.3%Overpressure Rupture
- 120.2%Special Incident
- Fire incident types reported to NFIRS in Stuarts Draft, VA
- 64366.2%Structure Fires
- 21522.1%Outside Fires
- 889.1%Mobile Property/Vehicle Fires
- 262.7%Other
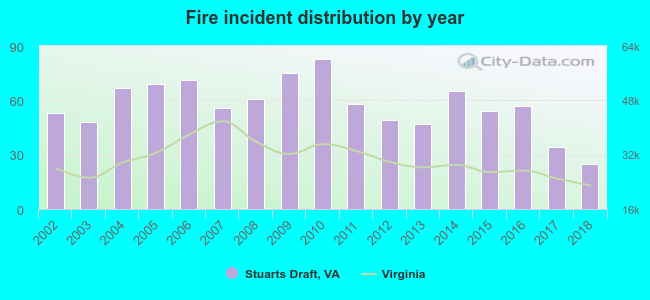 According to the data from the years 2002 - 2018 the average number of fires per year is 57. The highest number of fires - 83 took place in 2010, and the least - 25 in 2018. The data has a declining trend.
The average number of yearly fire incidents per 10k residents in Stuarts Draft, VA compared to nearest cities:
(Note: Based on data for the last 3 years, including only cities with population 5,000 and above)
| Stuarts Draft: | 41.9 |
| Fishersville: | 39.8 |
| Waynesboro: | 53.7 |
| Staunton: | 46.5 |
| Crozet: | 24.0 |
| Bridgewater: | 29.7 |
| Buena Vista: | 75.7 |
| Lexington: | 145.4 |
| Charlottesville: | 70.8 |
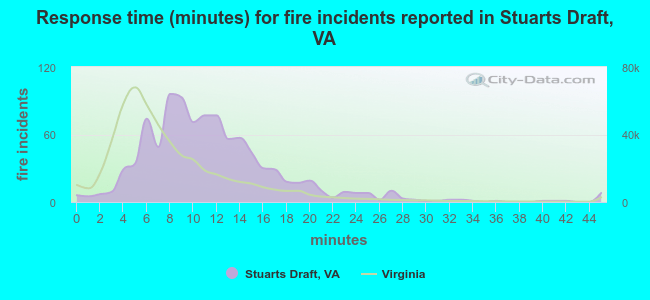 The median response time based on all reported fire incidents is 11 minutes. This is higher than the state median value.
The median response time in Stuarts Draft, VA compared to nearest cities:
(Note: Based on data for all years, including only cities with at least 500 fire incidents)
| Stuarts Draft: | 11 minutes |
| Fishersville: | 8 minutes |
| Greenville: | 15 minutes |
| Waynesboro: | 7 minutes |
| Staunton: | 7 minutes |
| Verona: | 9 minutes |
| Churchville: | 12 minutes |
| Grottoes: | 9 minutes |
| Bridgewater: | 11 minutes |
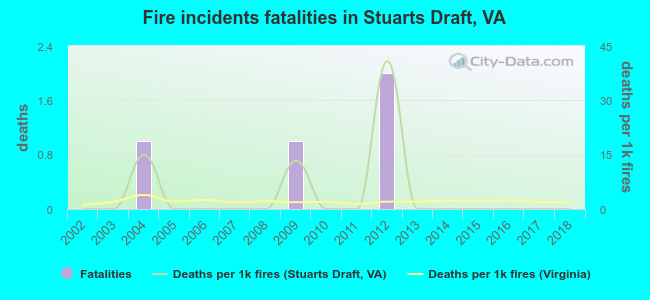 According to the reports from the years 2002 - 2018 the average number of fire-related yearly deaths is 0. The highest number of deaths - 2 took place in 2012, and the lowest - 0 in 2002. The data has a constant trend.
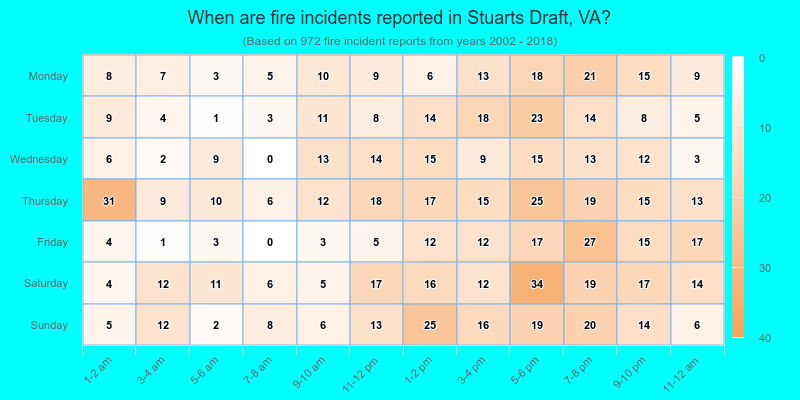
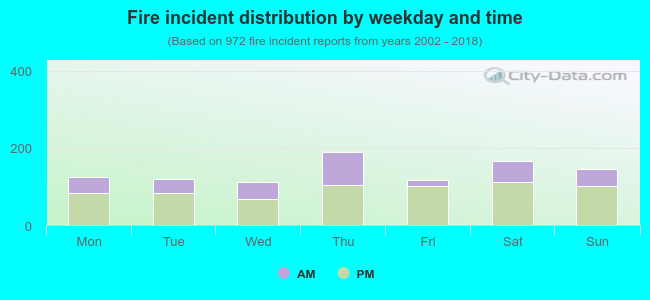 33.4% incidents where reported in the morning and 66.6% in the evening. The most fires (19.5%) took place on Thursday, and the least (11.4%) on Wednesday.
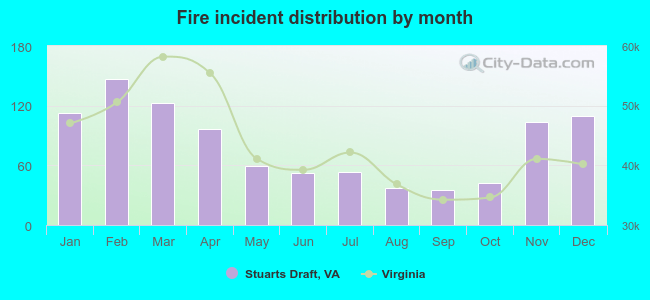 Based on the 972 fire incident reports from years 2002 - 2018 most fires (15.1%) took place during February, and the least (3.6%) in September.
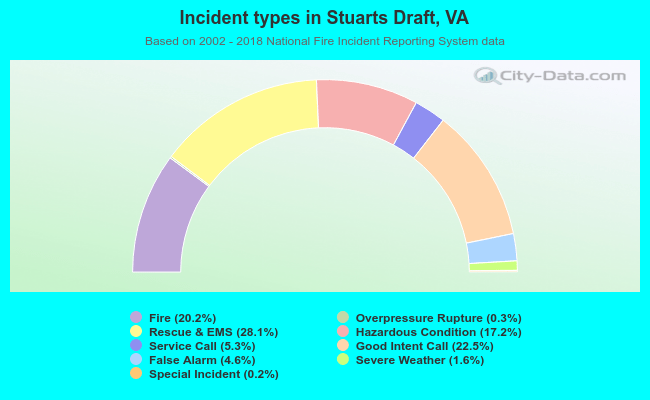 Out of all 4,802 cases reported during the years 2002 - 2018, the most belonged to the categories: Rescue & EMS (28.1%), Good Intent Call (22.5%), and Fire (20.2%).
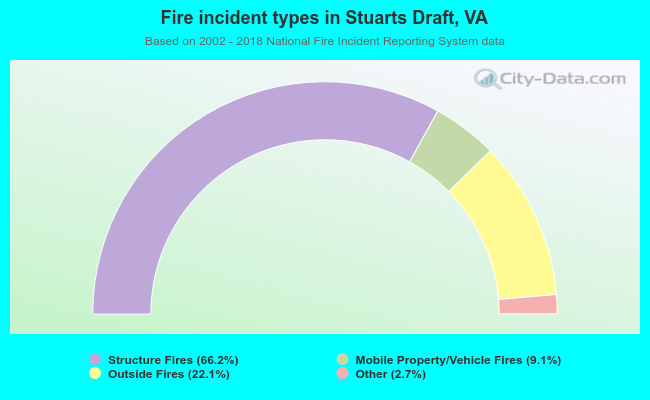 When looking into fire subcategories, the most incidents belonged to: Structure Fires (66.2%), and Outside Fires (22.1%).