| Fire incidents reported |
|---|
| Sreet name | Count |
|---|
| MAIN ST | 24 | | SUGAR GROVE RD | 22 | | BLUE VALLEY RD | 18 | | PUMP STATION RD | 12 | | SAVAGE HILL RD | 12 | | BUCKEYE RD | 10 | | CANAL ST | 10 | | HORNSMILL RD | 10 | | LOGAN-LANCASTER RD | 10 | | OLD LOGAN RD | 10 | | BORAH HILL RD | 8 | | BRUSHY FORK RD | 8 | | HANSLEY RD | 8 | | MCGRERY RD | 8 | | CARPENTER HILL RD | 6 | | CHICKEN COOP RD | 6 | | PARADISE RD | 6 | | ROLEY RD | 6 | | SPONAGLE RD | 6 | | SWARTZ MILL RD | 6 | | TARKILN RD | 6 | | TARKLILN RD | 6 | | BAUMAN HILL RD | 4 | | BLUEVALLEY RD | 4 | | CARPENTER RD | 4 |
| | | Fire incidents reported |
|---|
| Sreet name | Count |
|---|
| DUFFY RD | 4 | | FIRE TOWER RD | 4 | | GOSS RD | 4 | | HIDE AWAY HILLS RD | 4 | | KLUMP RD | 4 | | KRILE RD | 4 | | MAPLE ST | 4 | | ROCKSTULL RD | 4 | | ROSS RD | 4 | | SCHWILK RD | 4 | | SULLIVAN RD | 4 | | TAOS LN | 4 | | TARKLIN RD | 4 | | 1129 TARKLIN RD LOT 209 | 2 | | 5835 SWARTZ MILL ROAD | 2 | | 6147 SUGAR GROVE ROAD | 2 | | 7314 BUCKEYE ROAD | 2 | | 795 BLUE VALLEY RD | 2 | | BARNEBY RD | 2 | | BEAR RUN RD | 2 | | BECK | 2 | | BECK RD | 2 | | BIS RD | 2 | | BLUE VALLEY RD. | 2 | | |
|
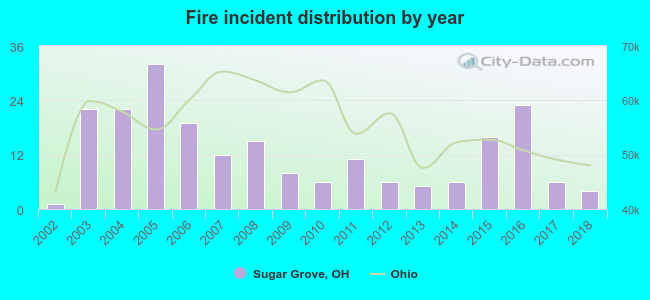 According to the data from the years 2002 - 2018 the average number of fire incidents per year is 13. The highest number of fire incidents - 32 took place in 2005, and the least - 1 in 2002. The data has a growing trend.
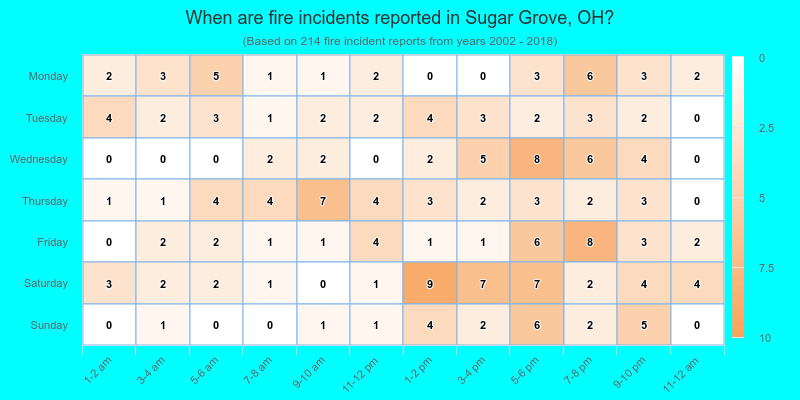
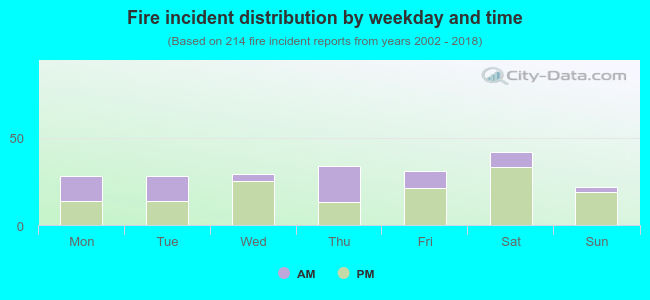 35.0% incidents where reported in the morning and 65.0% in the evening. The most fires (19.6%) took place on Saturday, and the least (10.3%) on Sunday.
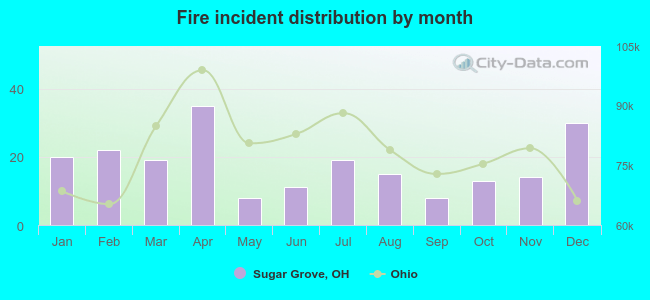 Based on the 214 fire incidents from years 2002 - 2018 most fires (16.4%) took place during April, and the least (3.7%) in May.
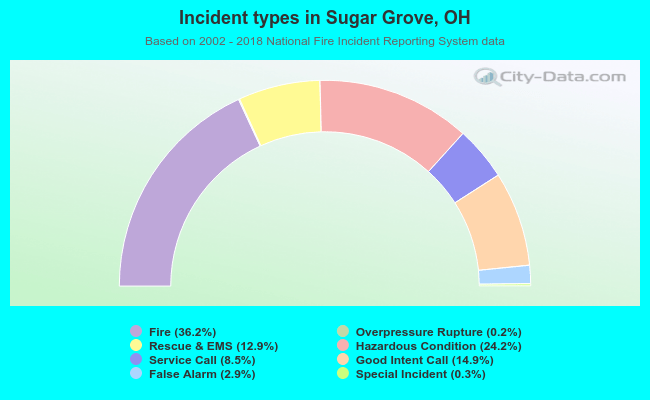 Out of all 591 cases reported during the years 2002 - 2018, the most belonged to the categories: Fire (36.2%), Hazardous Condition (24.2%), and Good Intent Call (14.9%).
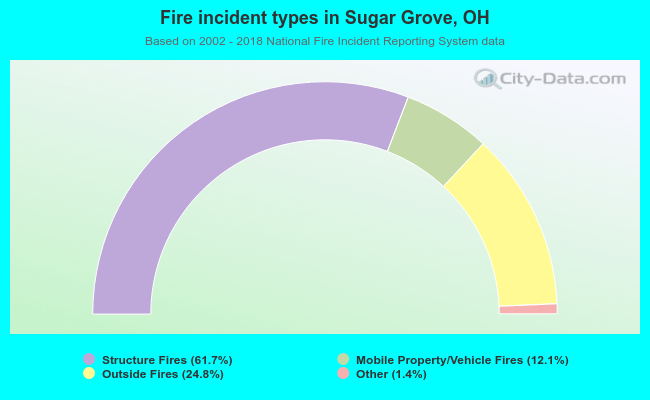 When looking into fire subcategories, the most reports belonged to: Structure Fires (61.7%), and Outside Fires (24.8%).