Sumrall: Fire Incidents, Mississippi (MS)
Where are fire incidents reported in Sumrall, MS
Something went wrong! Please refresh the page.
|
| |||||||||||||||||||||||||||||||||||||||||||||||||||||||||||||||||||||||||||||||||||||||||||||||||||||||||||||
| Other | 420 | |||||||||||||||||||||||||||||||||||||||||||||||||||||||||||||||||||||||||||||||||||||||||||||||||||||||||||||
2002 - 2018 National Fire Incident Reporting System (NFIRS) incidents
- Incident types reported to NFIRS in Sumrall, MS
- 1,62844.5%Fire
- 1,30535.6%Rescue & EMS
- 3028.2%Good Intent Call
- 2095.7%Hazardous Condition
- 952.6%Service Call
- 691.9%False Alarm
- 401.1%Severe Weather
- 90.2%Special Incident
- 40.1%Overpressure Rupture
- Fire incident types reported to NFIRS in Sumrall, MS
- 79749.0%Outside Fires
- 64539.6%Structure Fires
- 1217.4%Mobile Property/Vehicle Fires
- 654.0%Other
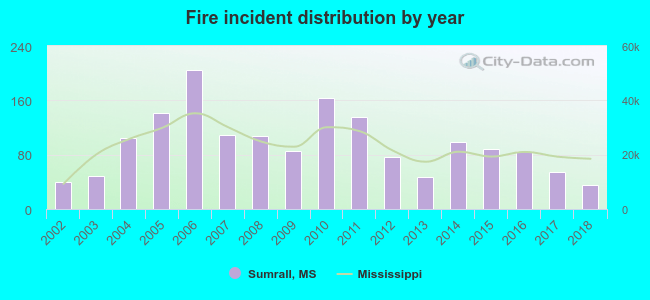 According to the data from the years 2002 - 2018 the average number of fire incidents per year is 96. The highest number of reported fire incidents - 204 took place in 2006, and the least - 36 in 2018. The data has a declining trend.
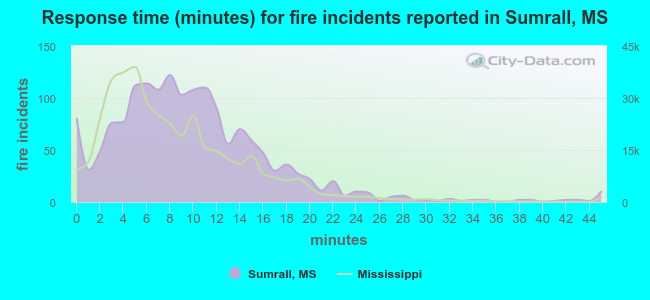 The median response time based on all reported fire incidents is 9 minutes. This is higher compared to the Mississippi median value.
The median response time in Sumrall, MS compared to nearest cities:
(Note: Based on data for all years, including only cities with at least 500 fire incidents)
| Sumrall: | 9 minutes |
| Seminary: | 9 minutes |
| Bassfield: | 5 minutes |
| Collins: | 9 minutes |
| Hattiesburg: | 5 minutes |
| Petal: | 5 minutes |
| Columbia: | 9 minutes |
| Purvis: | 7 minutes |
| Prentiss: | 10 minutes |
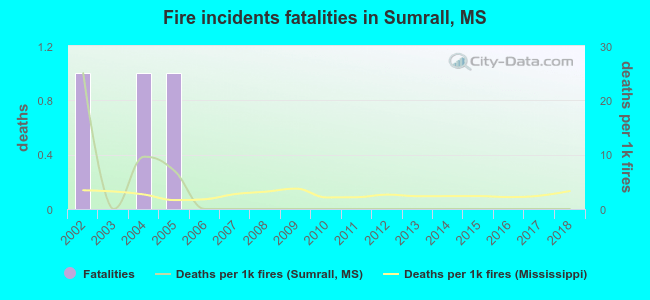 According to the data from the years 2002 - 2018 the average number of fire-related yearly deaths is 0. The highest number of deaths - 1 took place in 2002, and the lowest - 0 in 2003. The data has a declining trend.
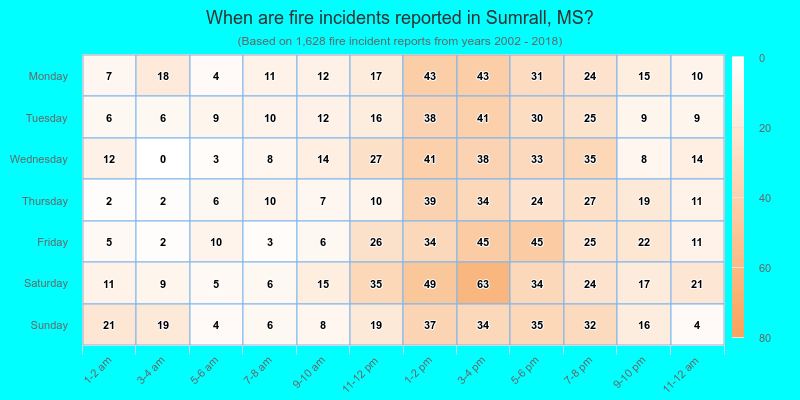
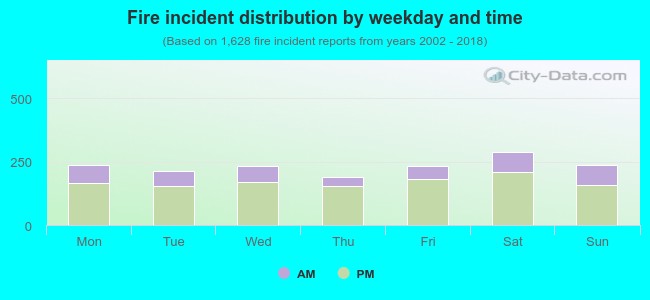 27.0% incidents where reported in the morning and 73.0% in the evening. The most fires (17.8%) took place on Saturday, and the least (11.7%) on Thursday.
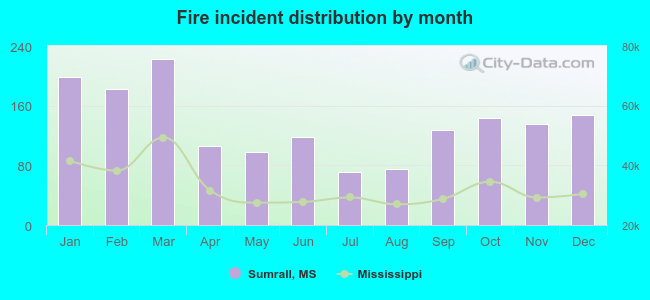 According to the 1,628 reports from years 2002 - 2018 most fires (13.7%) took place during March, and the least (4.4%) in July.
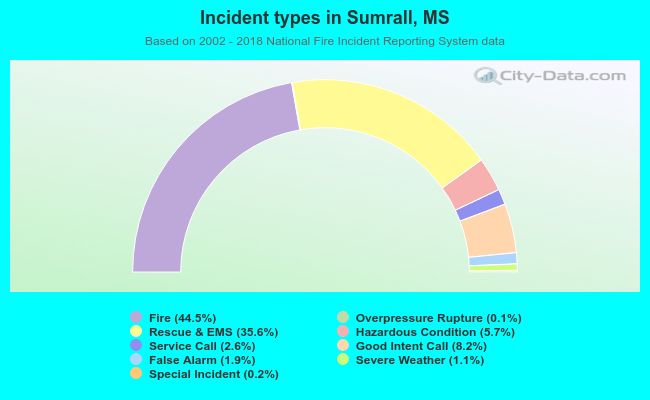 Out of all 3,661 cases reported during the years 2002 - 2018, the most belonged to the categories: Fire (44.5%), Rescue & EMS (35.6%), and Good Intent Call (8.2%).
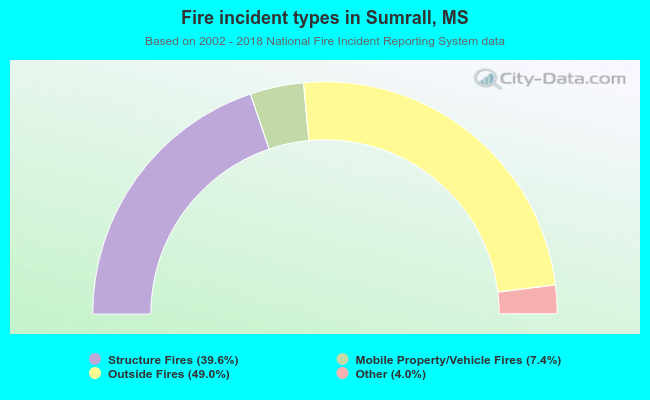 When looking into fire subcategories, the most reports belonged to: Outside Fires (49.0%), and Structure Fires (39.6%).