| Fire incidents reported |
|---|
| Sreet name | Count |
|---|
| AL HWY 10 | 84 | | CO RD 17 | 35 | | COXHEATH RD | 30 | | AL HWY 69 | 25 | | CO RD 6 | 25 | | HWY 10 | 25 | | RAINBOW CIRCLE | 20 | | 180 RAINBOW CIRCLE | 19 | | CO RD 15 | 19 | | 528 NICHOLSVILLE ROAD | 15 | | 60 APRIL LANE | 15 | | NICHOLSVILLE RD | 15 | | ST PAUL RD | 15 | | WAYNE ROAD | 12 | | 154 BLUE JAY DRIVE | 10 | | 3180 BASHI ROAD | 10 | | 346 WINTER DRIVE | 10 | | 35 SWAN DRIVE | 10 | | 820 NICHOLSVILLE RD | 10 | | 96 CALICO LANE | 10 | | CO RD 89 | 10 | | COUNTY 6 ROAD | 10 | | COUNTY RD 15 | 10 | | COUNTY RD. 7 | 10 | | COXHEATH ROAD | 10 |
| | | Fire incidents reported |
|---|
| Sreet name | Count |
|---|
| HALF ACRE CIR | 10 | | NICHOLSVILLE RD | 10 | | NICHOLSVILLE ROAD | 10 | | SOUTHERN PINE RD | 10 | | 1155 COXHEATH ROAD | 9 | | 1997 NICHOLSVILLE ROAD | 9 | | 33003 AL HWY 10 | 9 | | 33930 AL HWY 10 | 9 | | CRESTWOOD ROAD | 9 | | SOUTHERN PINE ROAD | 9 | | 10 HWY | 5 | | 1060 NICHOLSVILLE RD | 5 | | 115 WREN LANE | 5 | | 1152 COXHEATH RD. | 5 | | 1184 RED OAK RD | 5 | | 1215 UNION GROVE ROAD | 5 | | 135 COUNTY RD. 8 | 5 | | 135 COUNTY ROAD 29 | 5 | | 1365 COXHEATH ROAD | 5 | | 1388 HALF ACRE CIRCLE | 5 | | 139 CO RD 29 | 5 | | 1440 NICHOLSVILLE ROAD | 5 | | 1485 COXHEATH ROAD | 5 | | 157 BLUE JAY DRIVE | 5 | | 1577 BEAVER CREEK RD. | 5 |
|
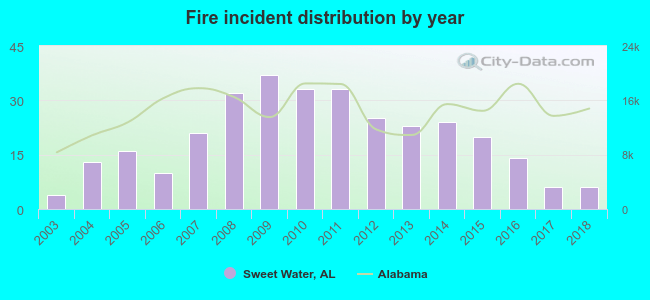 Based on the data from the years 2003 - 2018 the average number of fires per year is 20. The highest number of reported fires - 37 took place in 2009, and the least - 4 in 2003. The data has a rising trend.
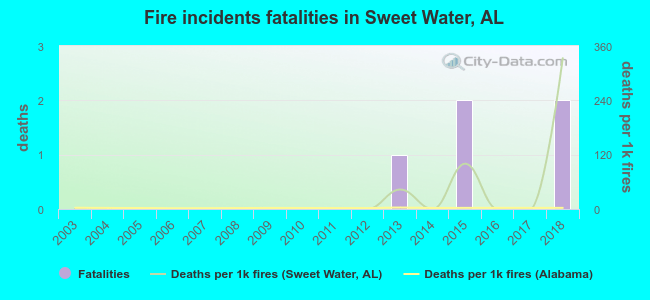 Based on the data from the years 2003 - 2018 the average number of fire-related fatalities per year is 0. The highest number of deaths - 2 took place in 2015, and the lowest - 0 in 2003. The data has a growing trend.
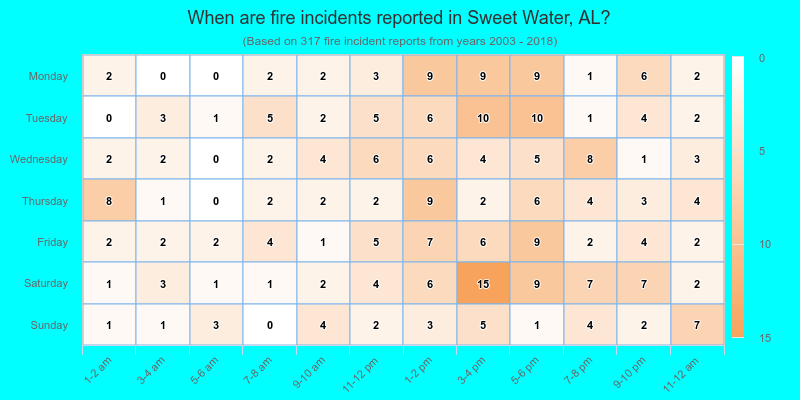
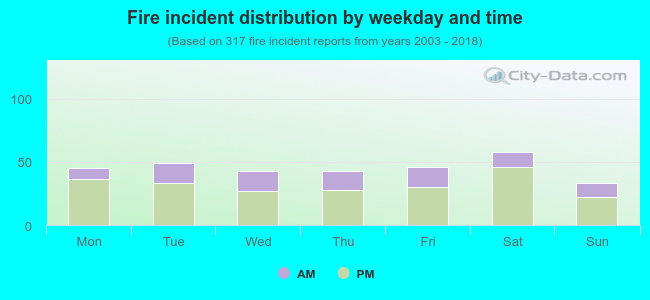 30.0% incidents where reported in the morning and 70.0% in the evening. The most fires (18.3%) took place on Saturday, and the least (10.4%) on Sunday.
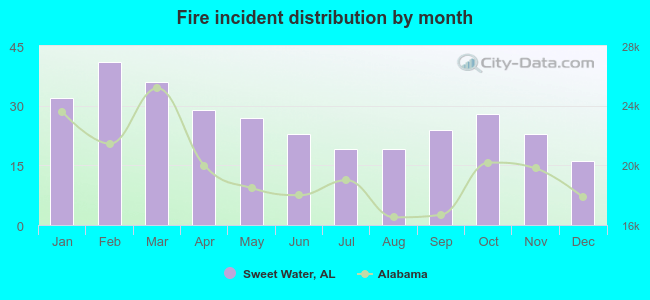 Based on the 317 fire incident reports from years 2003 - 2018 most fires (12.9%) took place during February, and the least (5.0%) in December.
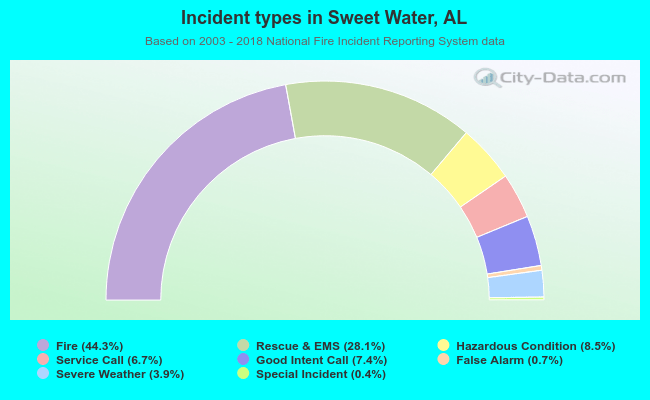 Out of all 716 cases reported during the years 2003 - 2018, the most belonged to the categories: Fire (44.3%), Overpressure Rupture (28.1%), and Rescue & EMS (8.5%).
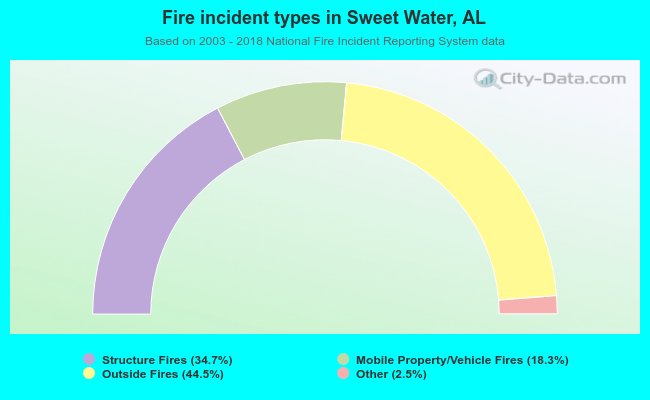 When looking into fire subcategories, the most incidents belonged to: Outside Fires (44.5%), and Structure Fires (34.7%).