| Fire incidents reported |
|---|
| Sreet name | Count |
|---|
| CO RD 27 | 83 | | BLUE POND BLVD | 45 | | AL HWY 75 | 35 | | CO RD 116 | 35 | | THIRD ST | 25 | | CO RD 515 | 24 | | CO RD 194 | 23 | | CO RD 180 | 20 | | CO RD 689 | 19 | | 6TH STREET | 15 | | CO RD 102 | 15 | | CO RD 47 | 15 | | COUNTY ROAD 91 | 15 | | MICHAEL RD | 15 | | MYRTLE LN | 15 | | COUNTY ROAD 572 | 13 | | 4TH ST | 10 | | BLUE POND BLVD | 10 | | BURNT CHURCH RD | 10 | | CO RD 122 | 10 | | CO RD 588 | 10 | | CO RD 680 | 10 | | CO RD 849 | 10 | | COUNTY ROAD 108 | 10 | | HWY 40 | 10 |
| | | Fire incidents reported |
|---|
| Sreet name | Count |
|---|
| MAIN ST | 10 | | ROAD 1996 | 10 | | SIXTH STREET SW | 10 | | THIRD ST SW | 10 | | CO RD 562 | 9 | | CO RD 91 | 9 | | AL HWY 75 EAST | 8 | | CO RD 572 | 8 | | HENDRIX RD | 5 | | 3RD ST | 5 | | 3RD STEET | 5 | | 4TH | 5 | | 5TH ST NORTH | 5 | | 684 RD | 5 | | 6TH ST | 5 | | 6TH ST | 5 | | AL HWY 117 | 5 | | AL HWY 75 S | 5 | | BLUE POND RD | 5 | | BLUE POND BLVD BLVD | 5 | | BLUE POND RD | 5 | | BLUE POND W BLVD | 5 | | BURNT CHURCH | 5 | | CARISSA RD | 5 | | CO RD 108 | 5 |
|
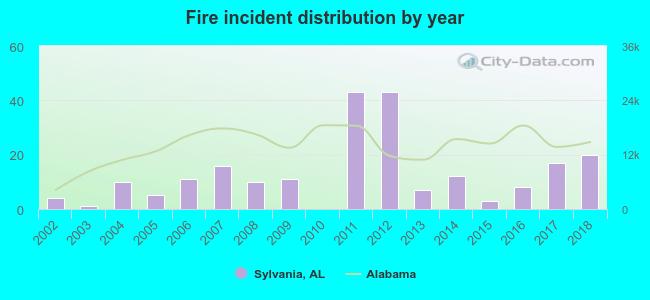 Based on the data from the years 2002 - 2018 the average number of fires per year is 13. The highest number of reported fire incidents - 43 took place in 2011, and the least - 0 in 2010. The data has a growing trend.
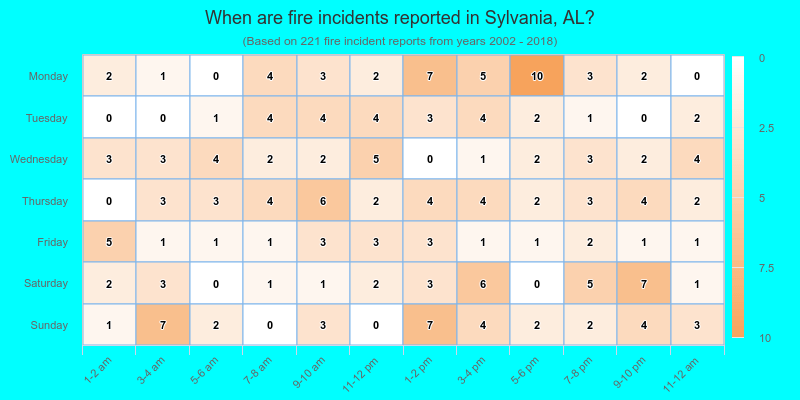
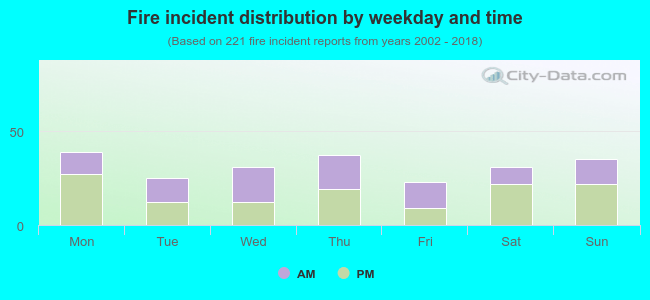 44.3% incidents where reported in the morning and 55.7% in the evening. The most fires (17.6%) took place on Monday, and the least (10.4%) on Friday.
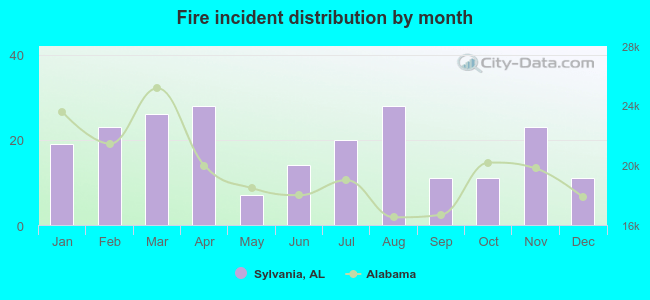 Based on the 221 fire incidents from years 2002 - 2018 most fires (12.7%) took place during April, and the least (3.2%) in May.
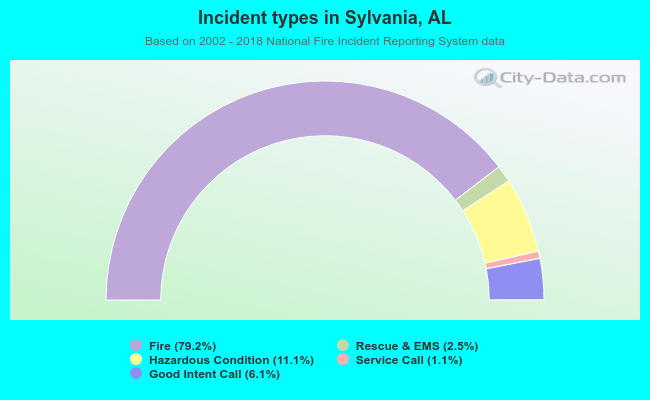 Out of all 279 cases reported during the years 2002 - 2018, the most belonged to the categories: Fire (79.2%), Rescue & EMS (11.1%), and Service Call (6.1%).
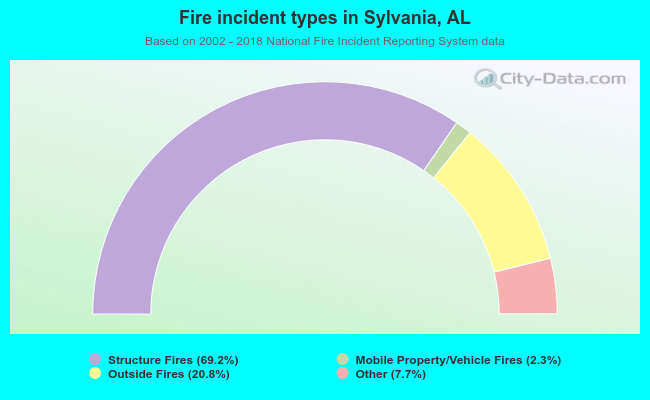 When looking into fire subcategories, the most reports belonged to: Structure Fires (69.2%), and Outside Fires (20.8%).