Tualatin: Fire Incidents, Oregon (OR)
Where are fire incidents reported in Tualatin, OR
Something went wrong! Please refresh the page.
| Fire incidents reported | |
|---|---|
| Sreet name | Count |
| BOONES FERRY RD | 118 |
| NYBERG | 104 |
| BOONES FERRY | 88 |
| UNREPORTED | 88 |
| NYBERG ST | 80 |
| TUALATIN RD | 62 |
| TUALATIN | 58 |
| TUALATIN SHERWOOD | 54 |
| MARTINAZZI AVE | 52 |
| SAGERT | 52 |
| 65TH | 48 |
| MOHAWK ST | 44 |
| 65TH AVE | 42 |
| SAGERT ST | 42 |
| MARTINAZZI | 38 |
| TUALATIN SHERWOOD RD | 30 |
| MOHAWK | 28 |
| CIPOLE RD | 24 |
| HERMAN | 24 |
| INTERSTATE 5 FWY | 24 |
| LOWER BOONES FERRY | 24 |
| STAFFORD RD | 22 |
| BORLAND RD | 20 |
| HERMAN RD | 20 |
| PACIFIC | 20 |
| PACIFIC HWY | 20 |
| 90TH AVE | 18 |
| AVERY | 18 |
| AVERY ST | 16 |
| NYBERG LN | 16 |
| Other | 4 |
2002 - 2017 National Fire Incident Reporting System (NFIRS) incidents
- Incident types reported to NFIRS in Tualatin, OR
- 4,36654.1%Rescue & EMS
- 1,29816.1%Fire
- 94711.7%Good Intent Call
- 5777.2%Hazardous Condition
- 4755.9%Service Call
- 3924.9%False Alarm
- Fire incident types reported to NFIRS in Tualatin, OR
- 58545.1%Outside Fires
- 47836.8%Structure Fires
- 21816.8%Mobile Property/Vehicle Fires
- 171.3%Other
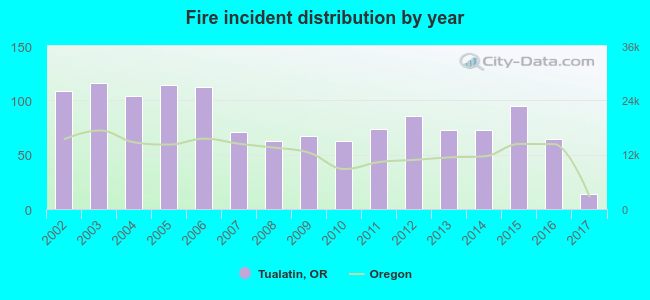 According to the data from the years 2002 - 2017 the average number of fire incidents per year is 81. The highest number of reported fire incidents - 116 took place in 2003, and the least - 14 in 2017. The data has a dropping trend.
The average number of yearly fire incidents per 10k residents in Tualatin, OR compared to nearest cities:
(Note: Based on data for the last 3 years, including only cities with population 5,000 and above)
| Tualatin: | 14.5 |
| Tigard: | 12.3 |
| Sherwood: | 7.9 |
| Lake Oswego: | 12.6 |
| Wilsonville: | 9.7 |
| West Linn: | 8.0 |
| Oak Grove: | 1.6 |
| Beaverton: | 16.8 |
| Canby: | 30.4 |
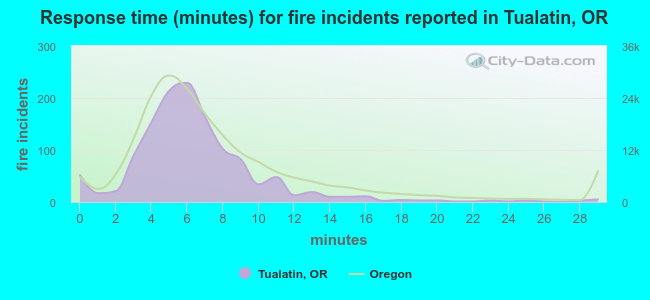 The median response time based on all reported fire incidents is 6 minutes. This is comparable to the state median value.
The median response time in Tualatin, OR compared to nearest cities:
(Note: Based on data for all years, including only cities with at least 500 fire incidents)
| Tualatin: | 6 minutes |
| Tigard: | 6 minutes |
| Sherwood: | 7 minutes |
| Lake Oswego: | 6 minutes |
| Wilsonville: | 6 minutes |
| West Linn: | 7 minutes |
| Beaverton: | 6 minutes |
| Canby: | 7 minutes |
| Oregon City: | 6 minutes |
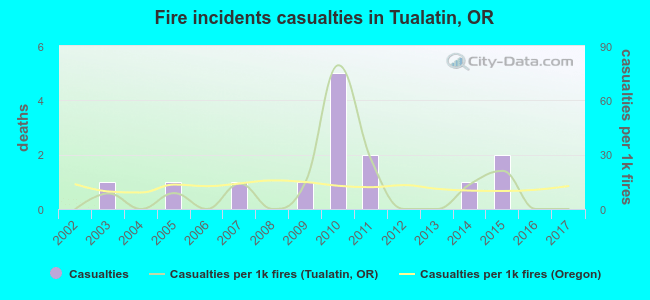 According to the data from the years 2002 - 2017 the average number of fire-related casualties per year is 1. The highest number of casualties - 5 took place in 2010, and the lowest - 0 in 2002. The data has a constant trend.
The average number of injuries per 1,000 fire incidents is 12. This indicator was the highest - 79 in 2010, and the lowest 0 in 2002. The trend for injuries per 1,000 incidents is constant. Compared to the state value the number of casualties per 1,000 incidents is similar.
According to the data from the years 2002 - 2017 the average number of fire-related casualties per year is 1. The highest number of casualties - 5 took place in 2010, and the lowest - 0 in 2002. The data has a constant trend.
The average number of injuries per 1,000 fire incidents is 12. This indicator was the highest - 79 in 2010, and the lowest 0 in 2002. The trend for injuries per 1,000 incidents is constant. Compared to the state value the number of casualties per 1,000 incidents is similar.Casualties per 1,000 incidents in Tualatin, OR compared to nearest cities:
(Note: Based on data for all years, including only cities with at least 500 fire incidents)
| Tualatin: | 10.8 |
| Tigard: | 16.8 |
| Sherwood: | 8.6 |
| Lake Oswego: | 13.1 |
| Wilsonville: | 11.0 |
| West Linn: | 4.0 |
| Beaverton: | 15.3 |
| Canby: | 10.8 |
| Oregon City: | 9.7 |
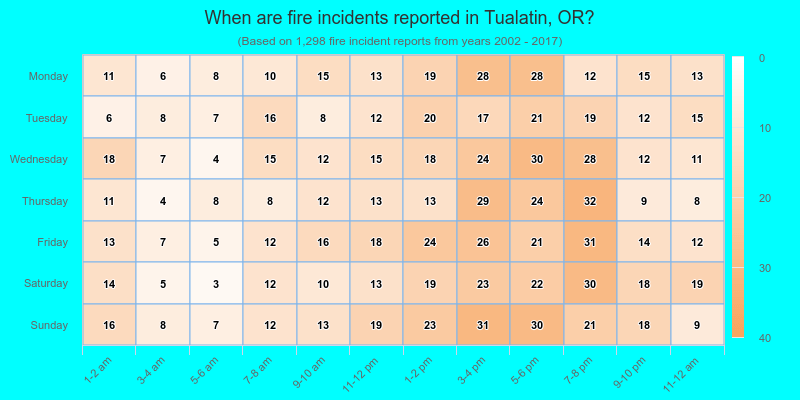
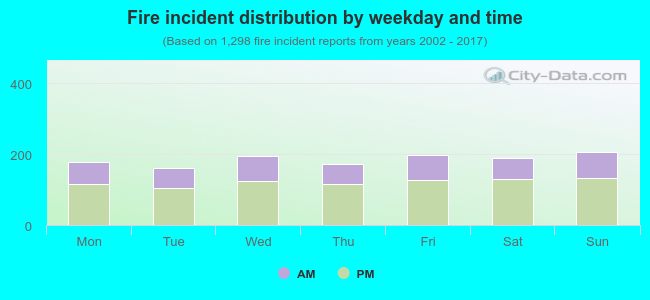 34.7% incidents where reported in the morning and 65.3% in the evening. The most fires (15.9%) took place on Sunday, and the least (12.4%) on Tuesday.
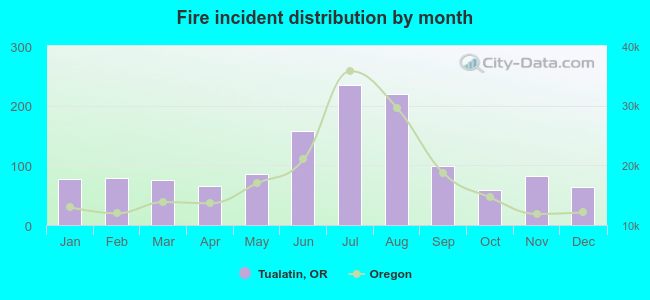 According to the 1,298 fires from years 2002 - 2017 most fires (18.1%) took place during July, and the least (4.5%) in October.
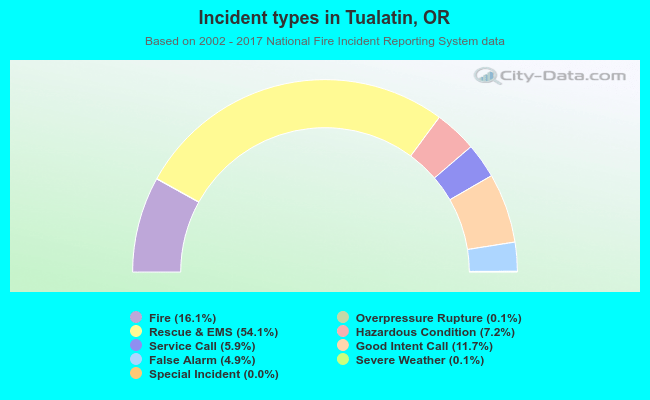 Out of all 8,069 cases reported during the years 2002 - 2017, the most belonged to the categories: Rescue & EMS (54.1%), Fire (16.1%), and Good Intent Call (11.7%).
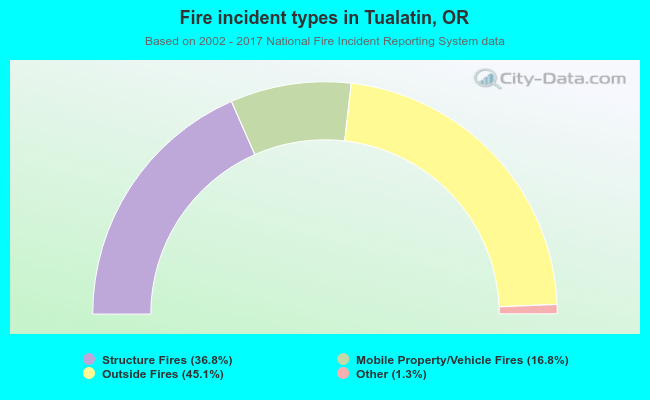 When looking into fire subcategories, the most reports belonged to: Outside Fires (45.1%), and Structure Fires (36.8%).