Unionville: Fire Incidents, Tennessee (TN)
Where are fire incidents reported in Unionville, TN
Something went wrong! Please refresh the page.
|
| |||||||||||||||||||||||||||||||||||||||||||||||||||||||||||||||||||||||||||||||||||||||||||||||||||||||||||||
2002 - 2018 National Fire Incident Reporting System (NFIRS) incidents
- Incident types reported to NFIRS in Unionville, TN
- 26542.9%Fire
- 18730.3%Rescue & EMS
- 6510.5%Good Intent Call
- 447.1%False Alarm
- 355.7%Hazardous Condition
- 172.8%Service Call
- 20.3%Overpressure Rupture
- 10.2%Severe Weather
- 10.2%Special Incident
- Fire incident types reported to NFIRS in Unionville, TN
- 12547.2%Outside Fires
- 8532.1%Structure Fires
- 4416.6%Mobile Property/Vehicle Fires
- 114.2%Other
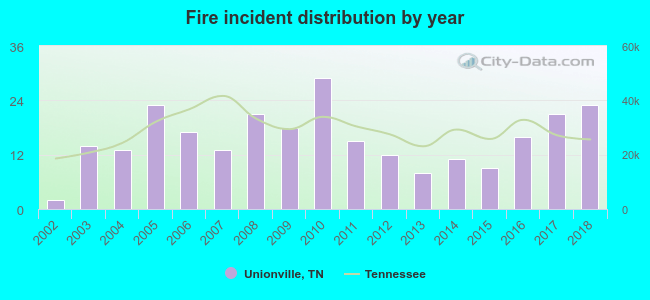 According to the data from the years 2002 - 2018 the average number of fires per year is 16. The highest number of fire incidents - 29 took place in 2010, and the least - 2 in 2002. The data has a rising trend.
The average number of yearly fire incidents per 10k residents in Unionville, TN compared to nearest cities:
(Note: Based on data for the last 3 years, including only cities with population 5,000 and above)
| Unionville: | 30.1 |
| Christiana: | 52.6 |
| Shelbyville: | 70.4 |
| Lewisburg: | 88.2 |
| Murfreesboro: | 42.6 |
| Spring Hill: | 17.9 |
| Nolensville: | 35.8 |
| Smyrna: | 37.8 |
| Franklin: | 30.3 |
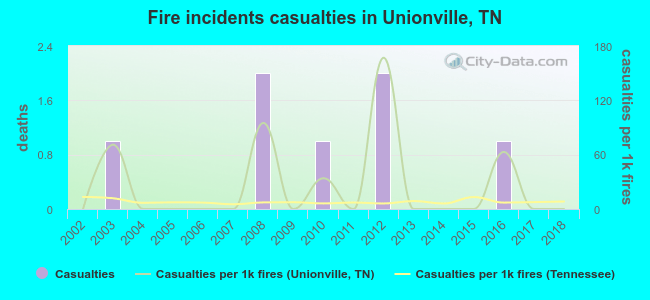 According to the data from the years 2002 - 2018 the average number of fire-related yearly casualties is 0. The highest number of reported casualties - 2 took place in 2008, and the lowest - 0 in 2002. The data has a constant trend.
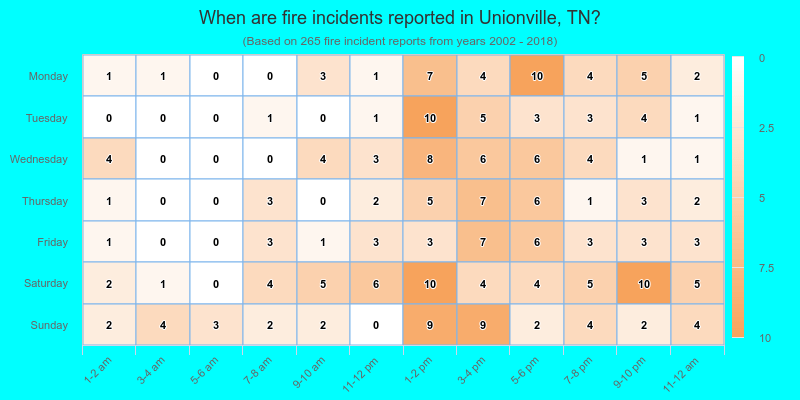
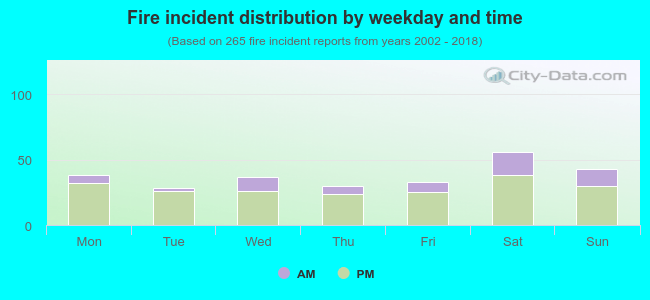 24.2% incidents where reported in the morning and 75.8% in the evening. The most fires (21.1%) took place on Saturday, and the least (10.6%) on Tuesday.
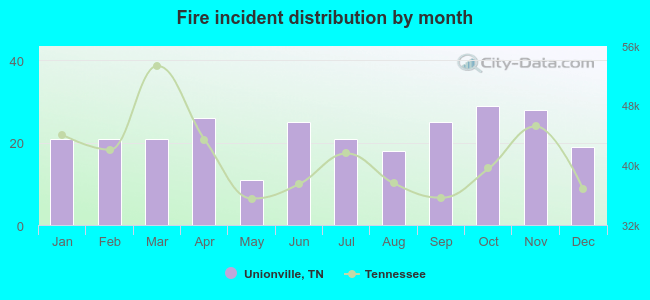 Based on the 265 fire incidents from years 2002 - 2018 most fires (10.9%) took place during October, and the least (4.2%) in May.
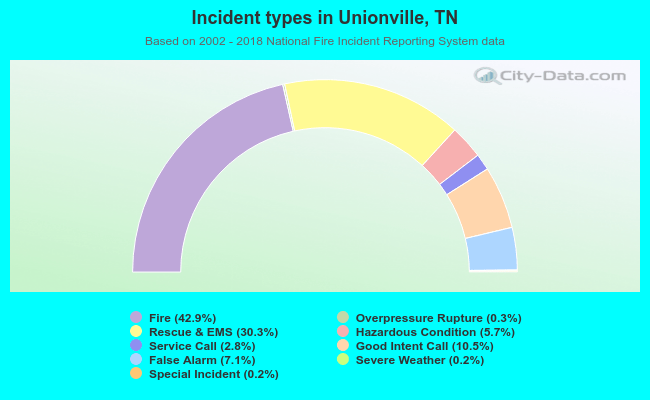 Out of all 617 cases reported during the years 2002 - 2018, the most belonged to the categories: Fire (42.9%), Rescue & EMS (30.3%), and Good Intent Call (10.5%).
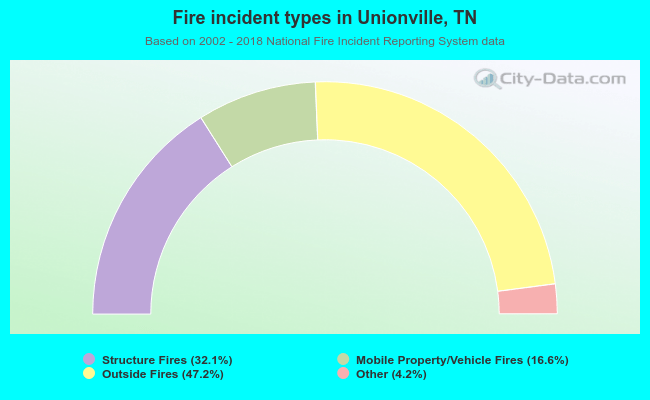 When looking into fire subcategories, the most incidents belonged to: Outside Fires (47.2%), and Structure Fires (32.1%).