University City: Fire Incidents, Missouri (MO)
Where are fire incidents reported in University City, MO
Something went wrong! Please refresh the page.
| Fire incidents reported | |
|---|---|
| Sreet name | Count |
| OLIVE BLVD | 204 |
| OLIVE BLVD. | 136 |
| DELMAR | 130 |
| DELMAR BLVD | 110 |
| WESTGATE AVE | 82 |
| OLIVE | 58 |
| WASHINGTON AVE | 50 |
| WESTGATE AVE. | 48 |
| DELCREST DR. | 46 |
| KINGSLAND AVE | 42 |
| CREST | 36 |
| BARTMER AVE. | 34 |
| JULIAN AVE | 34 |
| PLYMOUTH AVE | 34 |
| PENNSYLVANIA AVE | 32 |
| JULIAN AVE. | 30 |
| KINGSLAND AVE. | 30 |
| RAYMOND AVE | 30 |
| VERNON AVE. | 30 |
| WASHINGTON AVE. | 30 |
| 82ND ST. | 28 |
| APPLETON DR | 28 |
| BALSON AVE | 28 |
| DELCREST DR | 28 |
| ENRIGHT AVE | 28 |
| MELROSE AVE. | 28 |
| PLYMOUTH AVE. | 28 |
| CANTON AVE | 26 |
| PURDUE AVE | 26 |
| STANFORD | 26 |
| Other | 870 |
2002 - 2018 National Fire Incident Reporting System (NFIRS) incidents
- Incident types reported to NFIRS in University City, MO
- 2,49823.5%Rescue & EMS
- 2,37022.3%Fire
- 2,23321.0%Hazardous Condition
- 1,47013.9%Good Intent Call
- 1,30412.3%False Alarm
- 6676.3%Service Call
- 370.3%Special Incident
- 210.2%Overpressure Rupture
- Fire incident types reported to NFIRS in University City, MO
- 1,31855.6%Structure Fires
- 51321.6%Outside Fires
- 31313.2%Other
- 2269.5%Mobile Property/Vehicle Fires
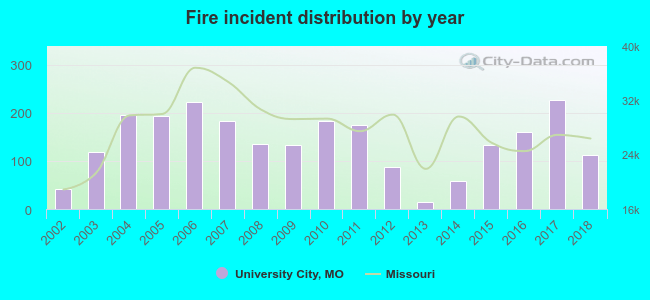 According to the data from the years 2002 - 2018 the average number of fire incidents per year is 139. The highest number of reported fire incidents - 226 took place in 2017, and the least - 14 in 2013. The data has an increasing trend.
The average number of yearly fire incidents per 10k residents in University City, MO compared to nearest cities:
(Note: Based on data for the last 3 years, including only cities with population 5,000 and above)
| University City: | 47.4 |
| Clayton: | 43.4 |
| Richmond Heights: | 78.9 |
| Olivette: | 45.9 |
| Overland: | 19.6 |
| Brentwood: | 51.4 |
| Ladue: | 48.2 |
| Maplewood: | 75.0 |
| Shrewsbury: | 28.5 |
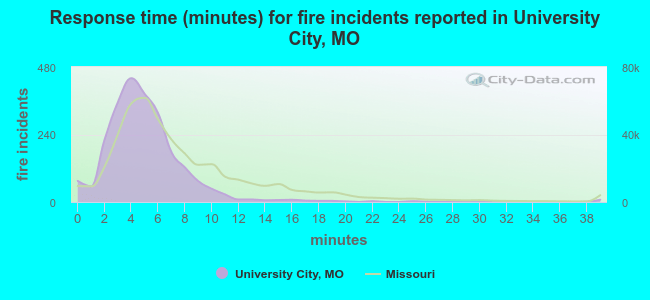 The median response time based on all reported fire incidents is 5 minutes. This is lower compared to the state median value.
The median response time in University City, MO compared to nearest cities:
(Note: Based on data for all years, including only cities with at least 500 fire incidents)
| University City: | 5 minutes |
| Clayton: | 4 minutes |
| Richmond Heights: | 5 minutes |
| Olivette: | 5 minutes |
| Overland: | 5 minutes |
| Brentwood: | 4 minutes |
| Ladue: | 6 minutes |
| Maplewood: | 4 minutes |
| Normandy: | 6 minutes |
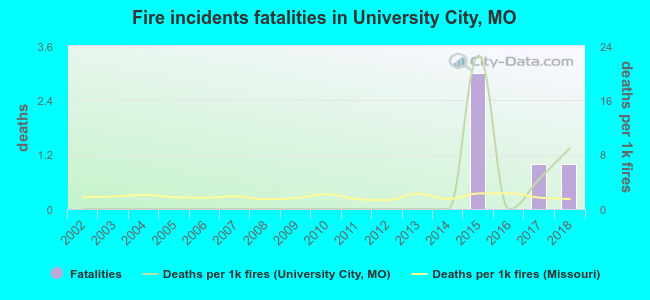 Based on the data from the years 2002 - 2018 the average number of fire-related fatalities per year is 0. The highest number of deaths - 3 took place in 2015, and the lowest - 0 in 2002. The data has a rising trend.
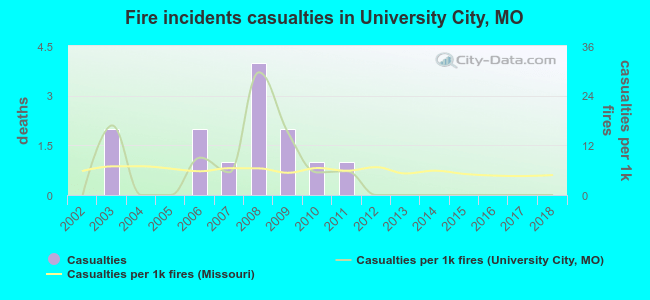 According to the reports from the years 2002 - 2018 the average number of fire-related casualties per year is 1. The highest number of reported casualties - 4 took place in 2008, and the lowest - 0 in 2002. The data has a constant trend.
The average number of casualties per 1,000 fire incidents is 5. This indicator was the highest - 30 in 2008, and the lowest 0 in 2002. The trend for injuries per 1,000 incidents is rising. Compared to the state value the number of casualties per 1,000 incidents is about the same.
According to the reports from the years 2002 - 2018 the average number of fire-related casualties per year is 1. The highest number of reported casualties - 4 took place in 2008, and the lowest - 0 in 2002. The data has a constant trend.
The average number of casualties per 1,000 fire incidents is 5. This indicator was the highest - 30 in 2008, and the lowest 0 in 2002. The trend for injuries per 1,000 incidents is rising. Compared to the state value the number of casualties per 1,000 incidents is about the same.
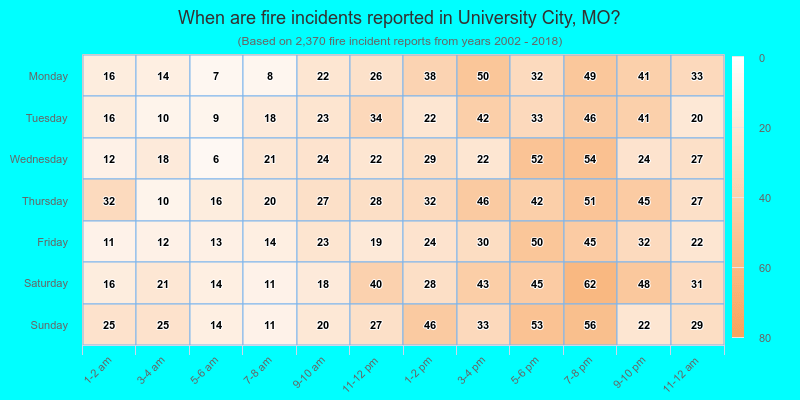
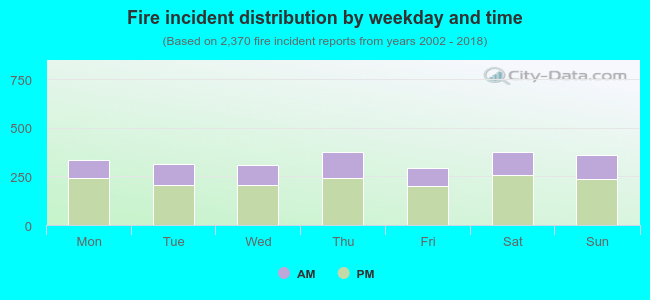 32.6% incidents where reported in the morning and 67.4% in the evening. The most fires (15.9%) took place on Saturday, and the least (12.4%) on Friday.
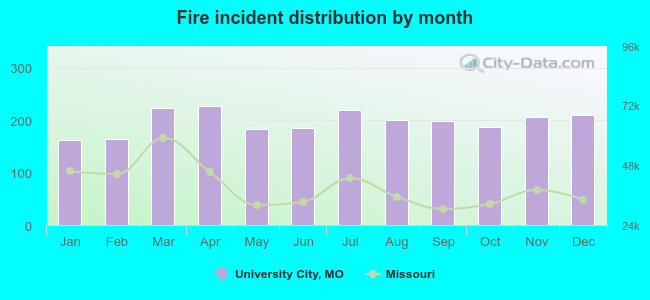 According to the 2,370 fire incidents from years 2002 - 2018 most fires (9.6%) took place during April, and the least (6.9%) in January.
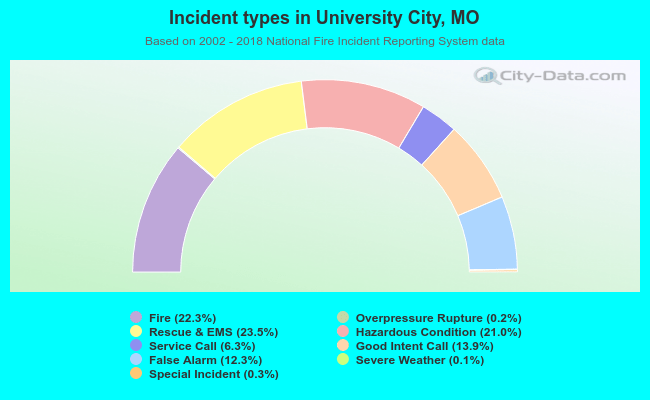 Out of all 10,610 cases reported during the years 2002 - 2018, the most belonged to the categories: Rescue & EMS (23.5%), Fire (22.3%), and Hazardous Condition (21.0%).
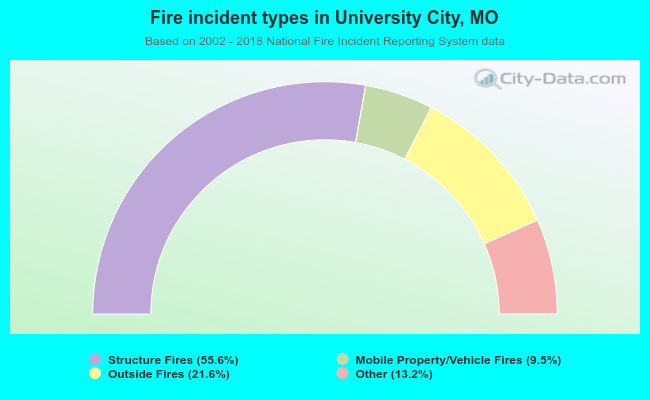 When looking into fire subcategories, the most incidents belonged to: Structure Fires (55.6%), and Outside Fires (21.6%).