University Heights: Fire Incidents, Ohio (OH)
Where are fire incidents reported in University Heights, OH
Something went wrong! Please refresh the page.
| Fire incidents reported | |
|---|---|
| Sreet name | Count |
| CEDAR RD | 510 |
| SILSBY RD | 88 |
| WARRENSVILLE CENTER RD | 76 |
| WASHINGTON BLVD | 52 |
| GREEN RD | 48 |
| FAIRMOUNT BLVD | 36 |
| BELVOIR BLVD | 30 |
| BUSHNELL RD | 26 |
| ASHURST RD | 24 |
| EDGERTON RD | 24 |
| GROVELAND RD | 24 |
| MILTON RD | 24 |
| TAYLOR RD | 24 |
| TRAYMORE RD | 24 |
| TULLAMORE RD | 24 |
| BAINTREE RD | 22 |
| SAYBROOK RD | 22 |
| WARRENSVILLE CENTER ROAD | 22 |
| SOUTH GREEN | 20 |
| CARROLL BLVD | 18 |
| MEADOWBROOK BLVD | 18 |
| CEDARBROOK RD | 16 |
| RUBYVALE RD | 16 |
| UNIVERSITY PARKWAY PKY | 16 |
| CHARNEY RD | 14 |
| CLAVER RD | 14 |
| LANSDALE RD | 14 |
| MIRAMAR RD | 14 |
| CEDAR CENTER | 12 |
| CHURCHILL BLVD | 12 |
2002 - 2018 National Fire Incident Reporting System (NFIRS) incidents
- Incident types reported to NFIRS in University Heights, OH
- 6,48958.1%Rescue & EMS
- 1,68815.1%Hazardous Condition
- 9818.8%False Alarm
- 8938.0%Fire
- 6545.9%Service Call
- 3563.2%Good Intent Call
- 690.6%Overpressure Rupture
- 340.3%Special Incident
- Fire incident types reported to NFIRS in University Heights, OH
- 70779.2%Structure Fires
- 11312.7%Outside Fires
- 626.9%Mobile Property/Vehicle Fires
- 111.2%Other
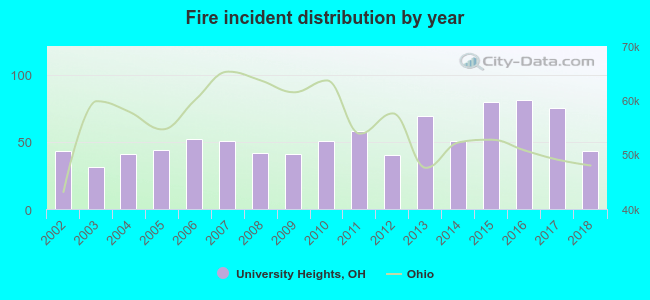 According to the data from the years 2002 - 2018 the average number of fires per year is 53. The highest number of reported fires - 81 took place in 2016, and the least - 31 in 2003. The data has a constant trend.
The average number of yearly fire incidents per 10k residents in University Heights, OH compared to nearest cities:
(Note: Based on data for the last 3 years, including only cities with population 5,000 and above)
| University Heights: | 50.2 |
| Shaker Heights: | 34.3 |
| Cleveland Heights: | 40.4 |
| Beachwood: | 34.5 |
| South Euclid: | 30.5 |
| Lyndhurst: | 28.4 |
| East Cleveland: | 85.7 |
| Pepper Pike: | 24.7 |
| Warrensville Heights: | 5.3 |
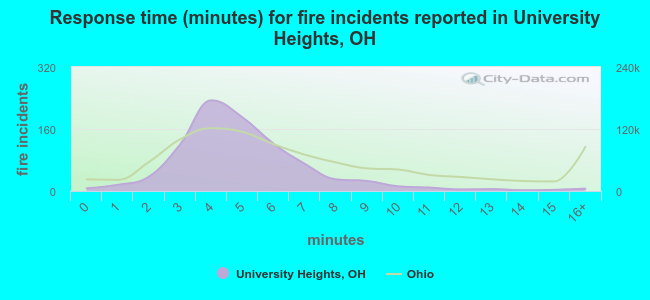 The median response time based on all reported fire incidents is 5 minutes. This is lower than the state median value.
The median response time in University Heights, OH compared to nearest cities:
(Note: Based on data for all years, including only cities with at least 500 fire incidents)
| University Heights: | 5 minutes |
| Shaker Heights: | 4 minutes |
| Cleveland Heights: | 5 minutes |
| Beachwood: | 4 minutes |
| South Euclid: | 6 minutes |
| Lyndhurst: | 5 minutes |
| East Cleveland: | 3 minutes |
| Mayfield Heights: | 4 minutes |
| Garfield Heights: | 4 minutes |
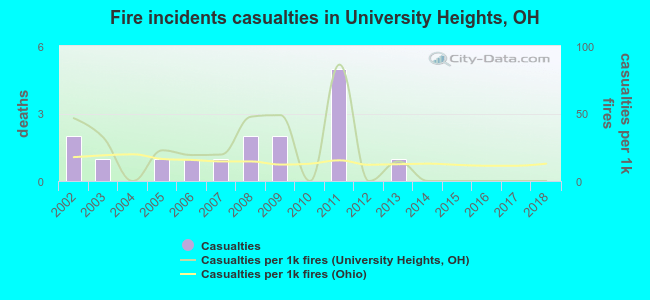 According to the data from the years 2002 - 2018 the average number of fire-related yearly casualties is 1. The highest number of casualties - 5 took place in 2011, and the lowest - 0 in 2004. The data has a declining trend.
The average number of injuries per 1,000 fire incidents is 20. This indicator was the highest - 86 in 2011, and the lowest 0 in 2004. The trend for injuries per 1,000 fires is decreasing. Compared to the Ohio value the number of injuries per 1,000 fires is higher.
According to the data from the years 2002 - 2018 the average number of fire-related yearly casualties is 1. The highest number of casualties - 5 took place in 2011, and the lowest - 0 in 2004. The data has a declining trend.
The average number of injuries per 1,000 fire incidents is 20. This indicator was the highest - 86 in 2011, and the lowest 0 in 2004. The trend for injuries per 1,000 fires is decreasing. Compared to the Ohio value the number of injuries per 1,000 fires is higher.Casualties per 1,000 incidents in University Heights, OH compared to nearest cities:
(Note: Based on data for all years, including only cities with at least 500 fire incidents)
| University Heights: | 17.9 |
| Shaker Heights: | 49.0 |
| Cleveland Heights: | 16.1 |
| Beachwood: | 2.9 |
| South Euclid: | 35.4 |
| Lyndhurst: | 12.4 |
| East Cleveland: | 13.0 |
| Mayfield Heights: | 5.3 |
| Garfield Heights: | 16.2 |
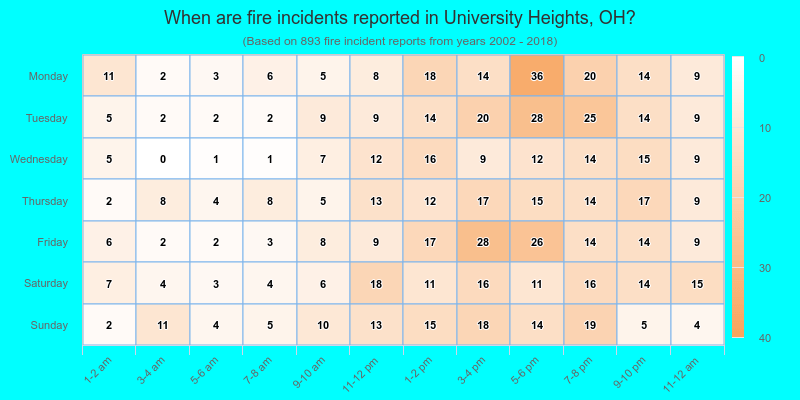
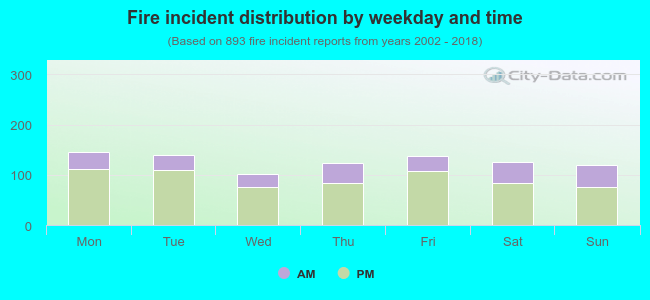 27.7% incidents where reported in the morning and 72.3% in the evening. The most fires (16.3%) took place on Monday, and the least (11.3%) on Wednesday.
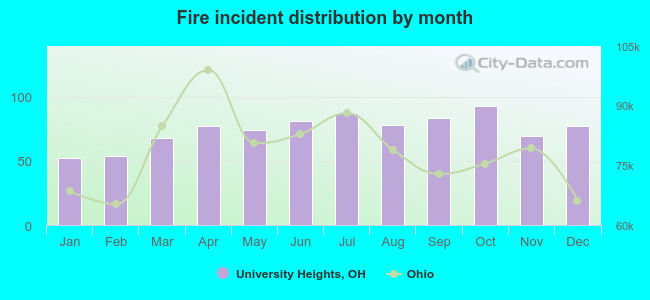 According to the 893 reports from years 2002 - 2018 most fires (10.4%) took place during October, and the least (5.8%) in January.
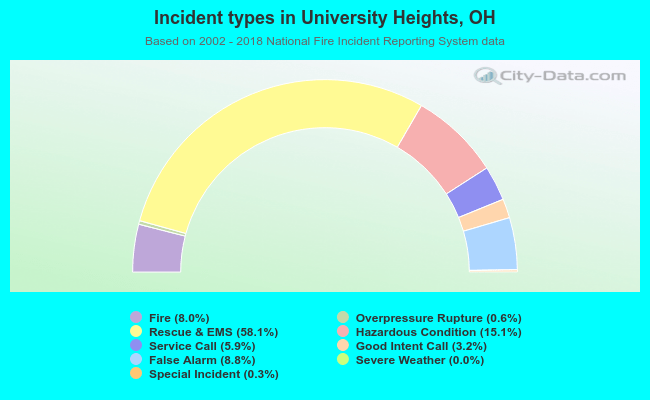 Out of all 11,167 cases reported during the years 2002 - 2018, the most belonged to the categories: Rescue & EMS (58.1%), Hazardous Condition (15.1%), and False Alarm (8.8%).
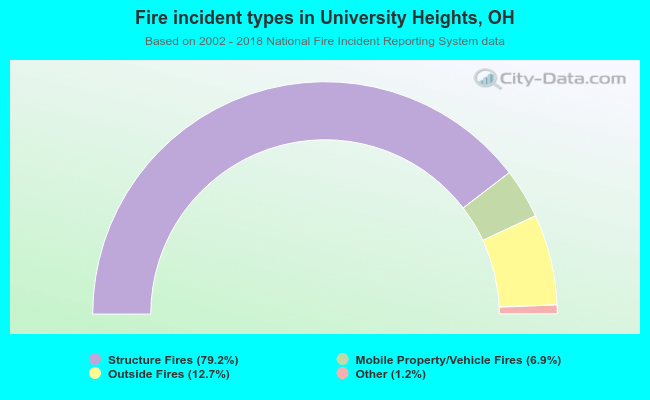 When looking into fire subcategories, the most incidents belonged to: Structure Fires (79.2%), and Outside Fires (12.7%).