Valley Falls: Fire Incidents, New York (NY)
Where are fire incidents reported in Valley Falls, NY
Something went wrong! Please refresh the page.
|
| |||||||||||||||||||||||||||||||||||||||||||||||||||||||||||||||||||||||||||||||||||||||||||||||||||||||||||||
2002 - 2018 National Fire Incident Reporting System (NFIRS) incidents
- Incident types reported to NFIRS in Valley Falls, NY
- 34647.2%Rescue & EMS
- 12517.1%Fire
- 11315.4%Hazardous Condition
- 7510.2%Service Call
- 425.7%Good Intent Call
- 233.1%False Alarm
- 50.7%Special Incident
- 30.4%Severe Weather
- 10.1%Overpressure Rupture
- Fire incident types reported to NFIRS in Valley Falls, NY
- 8467.2%Structure Fires
- 2016.0%Outside Fires
- 1713.6%Mobile Property/Vehicle Fires
- 43.2%Other
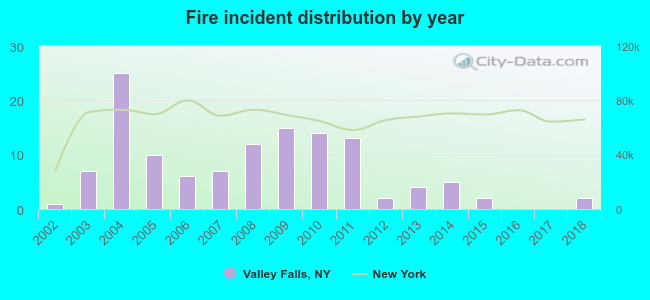 According to the data from the years 2002 - 2018 the average number of fires per year is 7. The highest number of fire incidents - 25 took place in 2004, and the least - 0 in 2016. The data has an increasing trend.
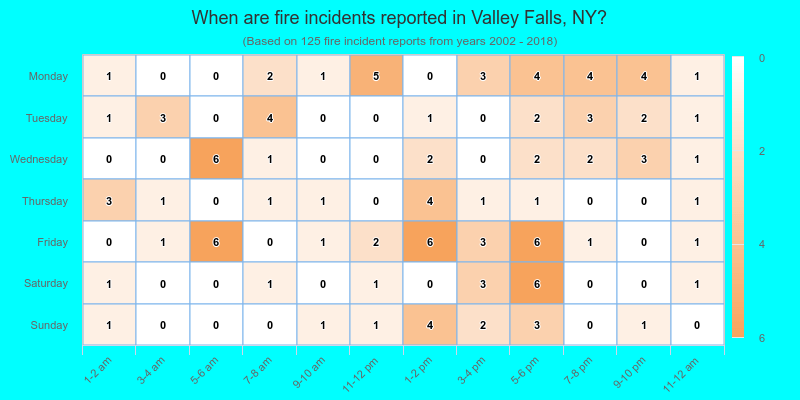
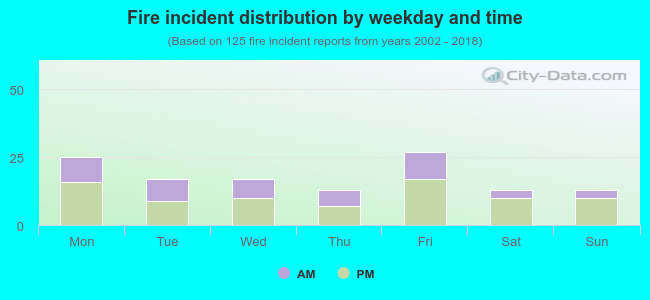 36.8% incidents where reported in the morning and 63.2% in the evening. The most fires (21.6%) took place on Friday, and the least (10.4%) on Thursday.
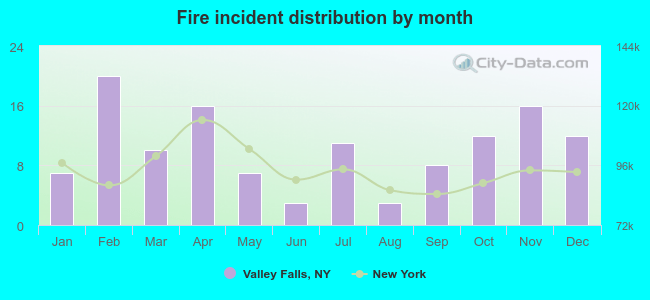 According to the 125 reports from years 2002 - 2018 most fires (16.0%) took place during February, and the least (2.4%) in June.
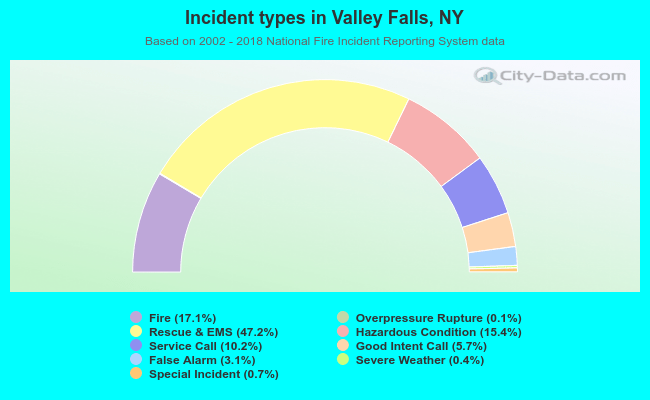 Out of all 733 cases reported during the years 2002 - 2018, the most belonged to the categories: Rescue & EMS (47.2%), Fire (17.1%), and Hazardous Condition (15.4%).
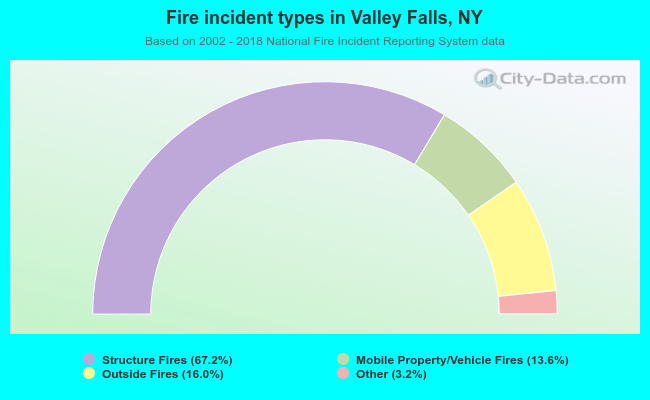 When looking into fire subcategories, the most incidents belonged to: Structure Fires (67.2%), and Outside Fires (16.0%).