| Fire incidents reported |
|---|
| Sreet name | Count |
|---|
| CABELA DR | 52 | | I70 HWY | 48 | | NATIONAL RD | 42 | | I-70 HWY | 32 | | ALEXANDER RD | 28 | | DALLAS PIKE RD | 22 | | WEST ALEXANDER RD | 16 | | DALLAS PIKE CAMPGROUND | 12 | | STEWART LN | 12 | | WASHINGTON CO | 12 | | TECHNOLOGY DR | 10 | | DIXONS RUN RD | 8 | | POINT RUN RD | 8 | | VALLEY GROVE RD | 8 | | CHAPEL HILL RD | 6 | | DEMENT RD | 6 | | MANNING DR | 6 | | MCGRAWS RUN RD | 6 | | MCGRAWS RUN ROAD RDS | 6 | | MUTUAL AID WEST ALEXANDER | 6 | | SAMPLE RD | 6 | | 177 FARMERS HILL RD | 4 | | 260 FLS DRIVE | 4 | | 270 WEST ALEXANDER RD | 4 | | 82 MANNING DRIVE | 4 |
| | | Fire incidents reported |
|---|
| Sreet name | Count |
|---|
| BATTLE RUN RD | 4 | | CHAMBERS LN | 4 | | FORT HENRY RD | 4 | | FOUR WINDS LN | 4 | | I-70 EAST AT 11 MI | 4 | | INTERSTATE 70 | 4 | | LAIDLEYS RUN RD | 4 | | MCCUTCHEON RD | 4 | | MCGRAWS RUN RD | 4 | | MUTUAL AID TRIADELPHIA | 4 | | MUTUAL AID WEST LIBERTY | 4 | | SATTERFIELD DR | 4 | | SHORT MCGRAWS RUN RD | 4 | | STOOLFIRE RD | 4 | | US40 RD | 4 | | 1 CABELA DR | 2 | | 104 VALLEY GROVE RD | 2 | | 1119 TIMBER HAVEN ROAD | 2 | | 129 MCGRAWS RUN | 2 | | 130 CRUZER ROAD | 2 | | 147 SAMPLE ROAD | 2 | | 153 TOLAND ROAD | 2 | | 156 SHORT MCGRAWS RUN | 2 | | 1845 W ALEXANDER RD | 2 | | |
|
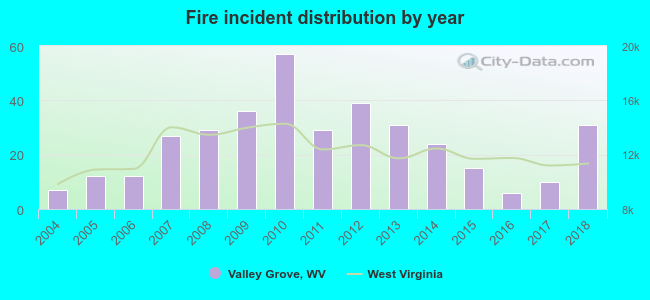 Based on the data from the years 2004 - 2018 the average number of fire incidents per year is 24. The highest number of reported fires - 57 took place in 2010, and the least - 6 in 2016. The data has a growing trend.
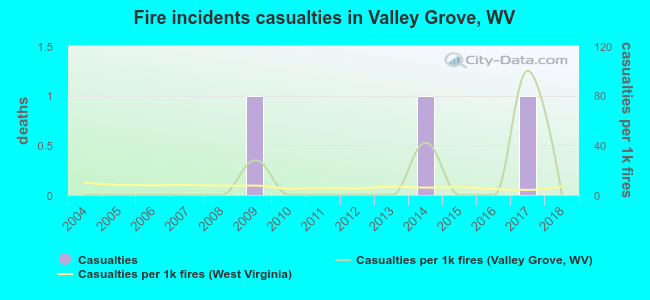 According to the reports from the years 2004 - 2018 the average number of fire-related yearly casualties is 0. The highest number of reported injuries - 1 took place in 2009, and the lowest - 0 in 2004. The data has a constant trend.
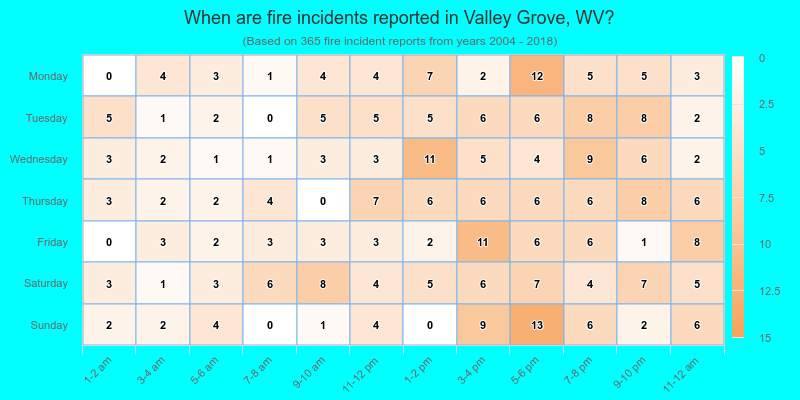
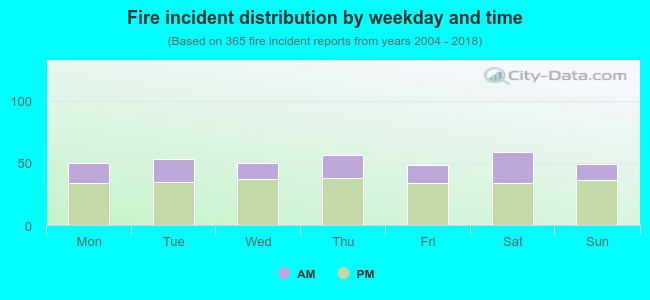 32.1% incidents where reported in the morning and 67.9% in the evening. The most fires (16.2%) took place on Saturday, and the least (13.2%) on Friday.
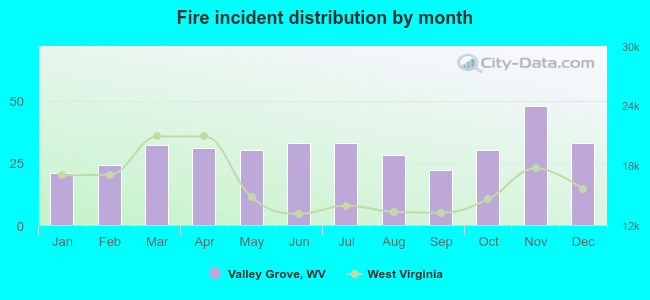 Based on the 365 incident reports from years 2004 - 2018 most fires (13.2%) took place during November, and the least (5.8%) in January.
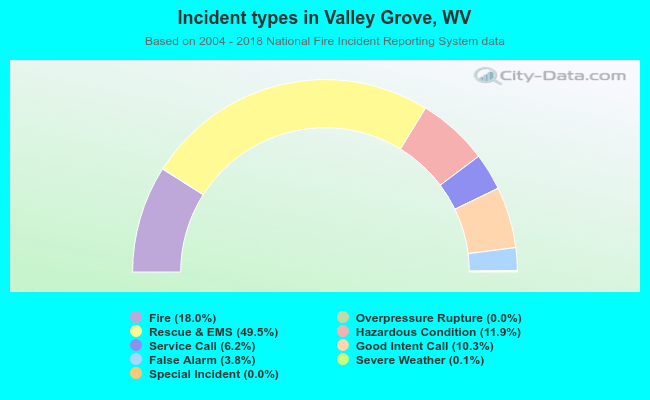 Out of all 2,026 cases reported during the years 2004 - 2018, the most belonged to the categories: Rescue & EMS (49.5%), Fire (18.0%), and Hazardous Condition (11.9%).
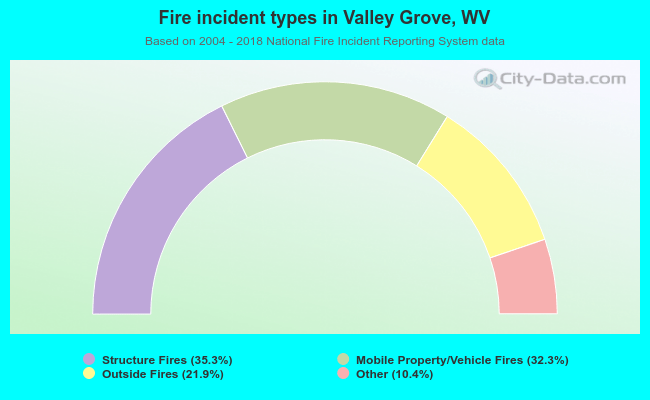 When looking into fire subcategories, the most incidents belonged to: Structure Fires (35.3%), and Mobile Property/Vehicle Fires (32.3%).