Valrico: Fire Incidents, Florida (FL)
Where are fire incidents reported in Valrico, FL
Something went wrong! Please refresh the page.
|
| |||||||||||||||||||||||||||||||||||||||||||||||||||||||||||||||||||||||||||||||||||||||||||||||||||||||||||||
2010 - 2018 National Fire Incident Reporting System (NFIRS) incidents
- Incident types reported to NFIRS in Valrico, FL
- 7,30981.9%Rescue & EMS
- 5796.5%Good Intent Call
- 3303.7%Fire
- 3153.5%Service Call
- 2162.4%Hazardous Condition
- 1511.7%False Alarm
- 220.2%Special Incident
- Fire incident types reported to NFIRS in Valrico, FL
- 13641.2%Structure Fires
- 11534.8%Outside Fires
- 6018.2%Mobile Property/Vehicle Fires
- 195.8%Other
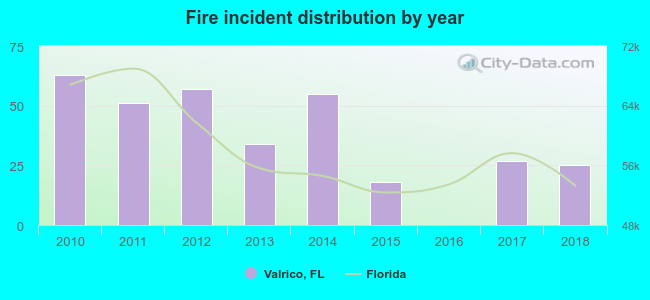 According to the data from the years 2010 - 2018 the average number of fire incidents per year is 37. The highest number of fires - 63 took place in 2010, and the least - 0 in 2016. The data has a decreasing trend.
The average number of yearly fire incidents per 10k residents in Valrico, FL compared to nearest cities:
(Note: Based on data for the last 3 years, including only cities with population 5,000 and above)
| Valrico: | 7.3 |
| Brandon: | 3.5 |
| Seffner: | 10.6 |
| Bloomingdale: | 1.8 |
| Riverview: | 4.0 |
| Thonotosassa: | 10.4 |
| Plant City: | 49.4 |
| Gibsonton: | 12.3 |
| Temple Terrace: | 16.8 |
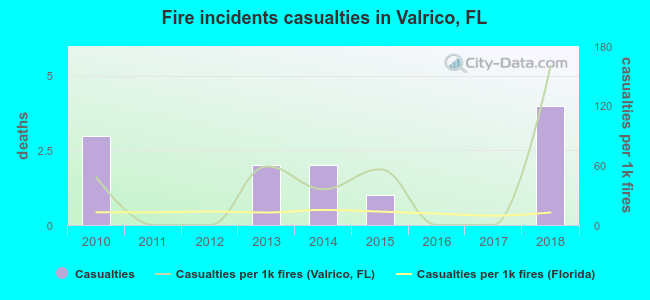 Based on the data from the years 2010 - 2018 the average number of fire-related casualties per year is 1. The highest number of reported casualties - 4 took place in 2018, and the lowest - 0 in 2011. The data has an increasing trend.
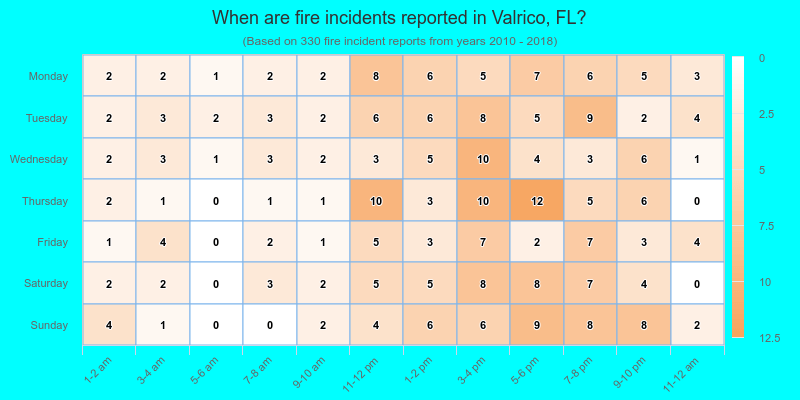
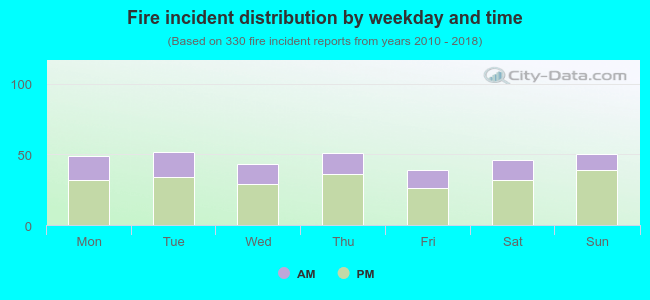 30.9% incidents where reported in the morning and 69.1% in the evening. The most fires (15.8%) took place on Tuesday, and the least (11.8%) on Friday.
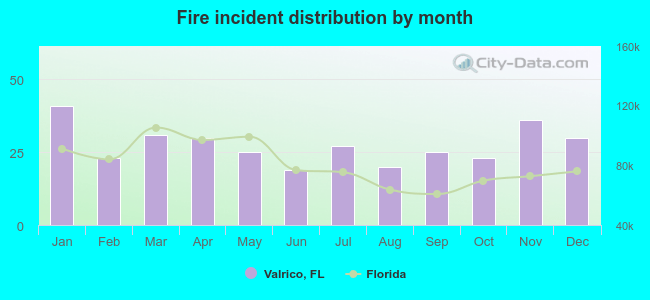 According to the 330 incident reports from years 2010 - 2018 most fires (12.4%) took place during January, and the least (5.8%) in June.
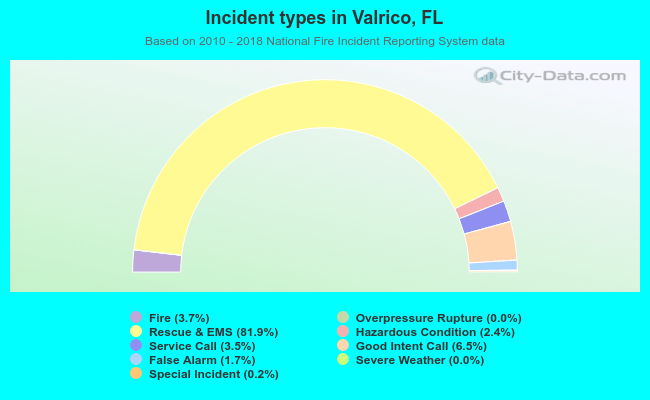 Out of all 8,927 cases reported during the years 2010 - 2018, the most belonged to the categories: Rescue & EMS (81.9%), Good Intent Call (6.5%), and Fire (3.7%).
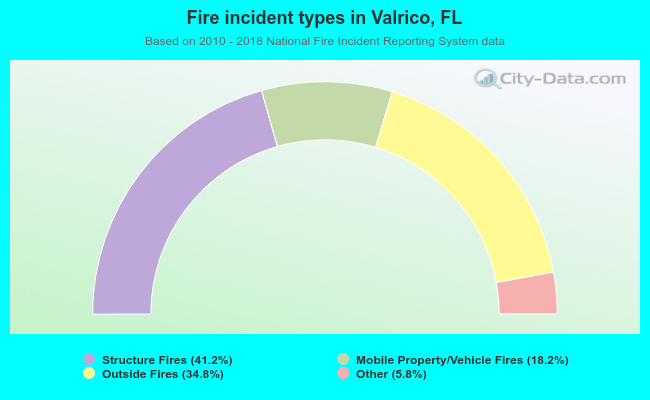 When looking into fire subcategories, the most reports belonged to: Structure Fires (41.2%), and Outside Fires (34.8%).