Vandalia: Fire Incidents, Ohio (OH)
Where are fire incidents reported in Vandalia, OH
Something went wrong! Please refresh the page.
| Fire incidents reported | |
|---|---|
| Sreet name | Count |
| DIXIE SOUTH DR | 102 |
| BROWN SCHOOL SOUTH RD | 80 |
| I 75 MM 614 653 | 48 |
| DIXIE NORTH DR | 42 |
| NATIONALEAST RD | 36 |
| POE AVE | 34 |
| TIMBERLAKE DR | 32 |
| CENTER DR | 28 |
| OLD SPRINGFIELD RD | 28 |
| WEBSTER ST | 28 |
| NATIONAL (EAST) RD | 26 |
| NATIONAL RD | 24 |
| NORTH WOODS EI75 BLVD | 24 |
| STONEQUARRY WEST RD | 24 |
| DIXIE DR | 22 |
| NATIONAL RD EAST | 22 |
| TIONDA SOUTH DR | 22 |
| CONTINENTAL CT | 20 |
| DIXIE | 20 |
| FOLEY DR | 20 |
| I75 MM 64-68 | 20 |
| ALKALINE SPRINGS WEST RD | 18 |
| I 75 MM 653 AND NORTH | 18 |
| INTERSTATE 75 | 18 |
| KENBROOK DR | 18 |
| NATIONAL (WEST) RD | 18 |
| WESTHAFER RD | 18 |
| BENCHWOOD DR | 16 |
| CASSEL NORTH RD | 16 |
| I70 | 16 |
| Other | 345 |
2002 - 2018 National Fire Incident Reporting System (NFIRS) incidents
- Incident types reported to NFIRS in Vandalia, OH
- 10,04259.4%Rescue & EMS
- 1,95311.6%Hazardous Condition
- 1,5639.2%Good Intent Call
- 1,2037.1%Fire
- 1,0896.4%Service Call
- 9815.8%False Alarm
- 430.3%Special Incident
- 220.1%Overpressure Rupture
- Fire incident types reported to NFIRS in Vandalia, OH
- 58949.0%Structure Fires
- 35429.4%Outside Fires
- 25721.4%Mobile Property/Vehicle Fires
- 30.2%Other
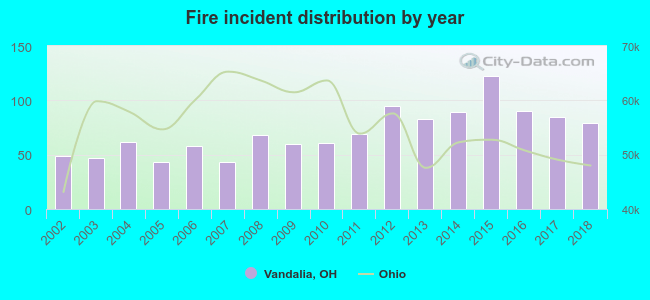 Based on the data from the years 2002 - 2018 the average number of fires per year is 71. The highest number of reported fires - 122 took place in 2015, and the least - 43 in 2005. The data has an increasing trend.
The average number of yearly fire incidents per 10k residents in Vandalia, OH compared to nearest cities:
(Note: Based on data for the last 3 years, including only cities with population 5,000 and above)
| Vandalia: | 55.9 |
| Huber Heights: | 30.3 |
| Shiloh: | 12.6 |
| Tipp City: | 55.5 |
| Englewood: | 42.9 |
| Union: | 18.8 |
| Clayton: | 22.0 |
| Trotwood: | 55.3 |
| Riverside: | 20.2 |
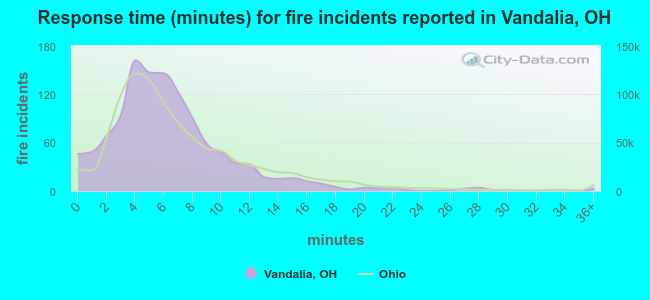 The median response time based on all reported fire incidents is 6 minutes. This is about the same as the Ohio median value.
The median response time in Vandalia, OH compared to nearest cities:
(Note: Based on data for all years, including only cities with at least 500 fire incidents)
| Vandalia: | 6 minutes |
| Huber Heights: | 6 minutes |
| Tipp City: | 10 minutes |
| Englewood: | 5 minutes |
| Trotwood: | 7 minutes |
| Riverside: | 6 minutes |
| Dayton: | 5 minutes |
| New Carlisle: | 8 minutes |
| Fairborn: | 6 minutes |
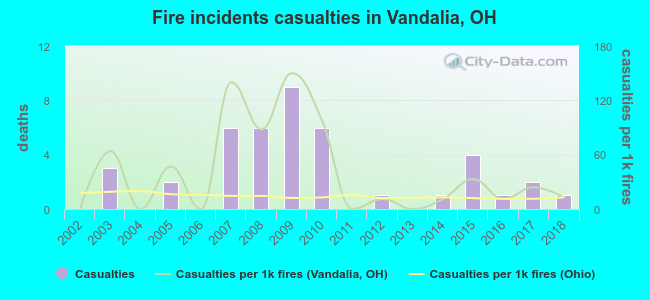 According to the data from the years 2002 - 2018 the average number of fire-related yearly casualties is 2. The highest number of injuries - 9 took place in 2009, and the lowest - 0 in 2002. The data has an increasing trend.
The average number of injuries per 1,000 fire incidents is 41. This indicator was the highest - 150 in 2009, and the lowest 0 in 2002. The trend for injuries per 1,000 fires is increasing. Compared to the state value the number of casualties per 1,000 fires is much higher.
According to the data from the years 2002 - 2018 the average number of fire-related yearly casualties is 2. The highest number of injuries - 9 took place in 2009, and the lowest - 0 in 2002. The data has an increasing trend.
The average number of injuries per 1,000 fire incidents is 41. This indicator was the highest - 150 in 2009, and the lowest 0 in 2002. The trend for injuries per 1,000 fires is increasing. Compared to the state value the number of casualties per 1,000 fires is much higher.Casualties per 1,000 incidents in Vandalia, OH compared to nearest cities:
(Note: Based on data for all years, including only cities with at least 500 fire incidents)
| Vandalia: | 34.9 |
| Huber Heights: | 35.6 |
| Tipp City: | 9.2 |
| Englewood: | 27.4 |
| Trotwood: | 34.2 |
| Riverside: | 19.3 |
| Dayton: | 20.5 |
| New Carlisle: | 4.3 |
| Fairborn: | 27.6 |
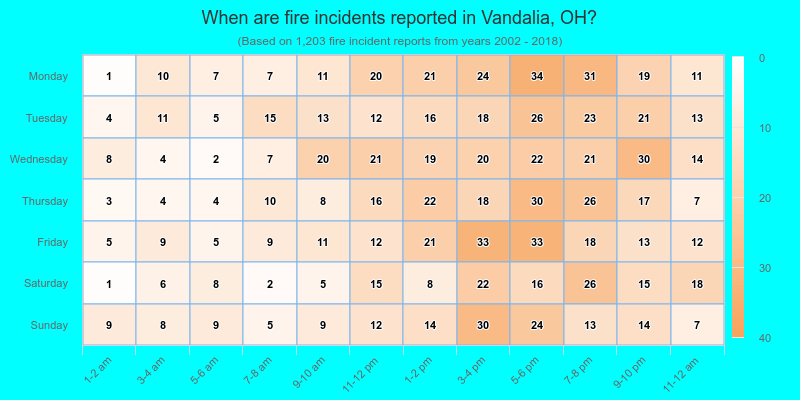
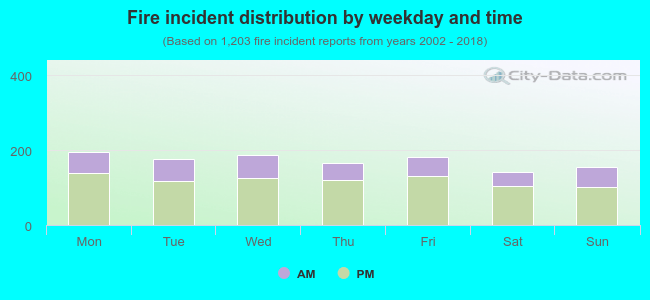 30.2% incidents where reported in the morning and 69.8% in the evening. The most fires (16.3%) took place on Monday, and the least (11.8%) on Saturday.
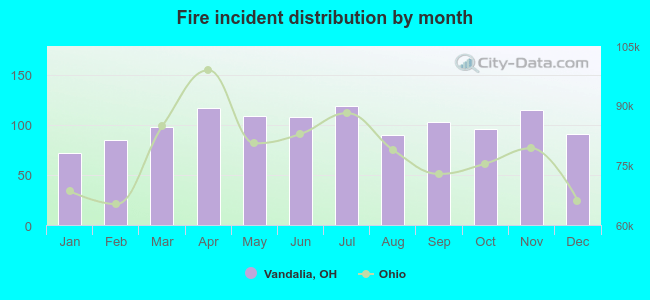 Based on the 1,203 incident reports from years 2002 - 2018 most fires (9.9%) took place during July, and the least (6.0%) in January.
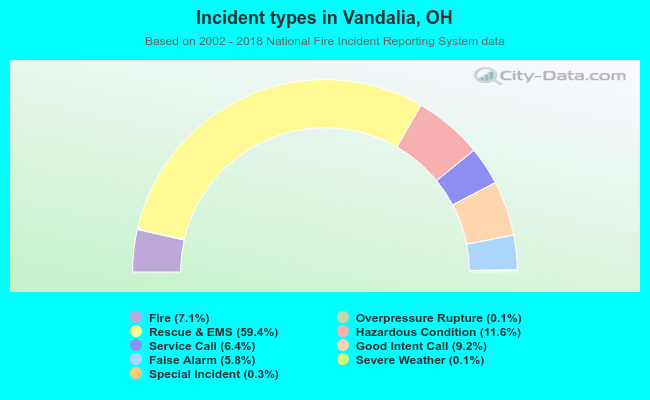 Out of all 16,909 cases reported during the years 2002 - 2018, the most belonged to the categories: Rescue & EMS (59.4%), Hazardous Condition (11.6%), and Good Intent Call (9.2%).
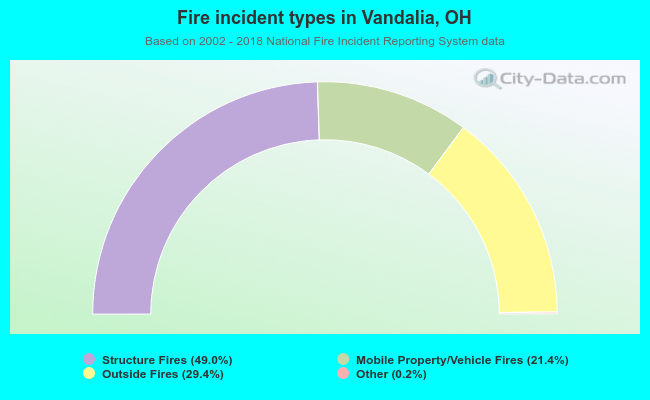 When looking into fire subcategories, the most reports belonged to: Structure Fires (49.0%), and Outside Fires (29.4%).