Ventura: Fire Incidents, California (CA)
Where are fire incidents reported in Ventura, CA
Something went wrong! Please refresh the page.
| Fire incidents reported | |
|---|---|
| Sreet name | Count |
| MAIN ST | 236 |
| HARBOR BLVD | 150 |
| VENTURA AVE | 112 |
| VICTORIA AVE | 108 |
| TELEPHONE RD | 88 |
| JOHNSON DR | 80 |
| THOMPSON BLVD | 78 |
| TELEGRAPH RD | 72 |
| SB 101 AT | 44 |
| MILLS RD | 42 |
| PETIT AVE | 40 |
| NB 101 AT | 38 |
| SANTA CLARA ST | 38 |
| SPINNAKER DR | 38 |
| WELLS RD | 38 |
| 101 FRWY | 36 |
| HARBOR | 34 |
| CHANNEL DR | 32 |
| P.C.H. | 32 |
| PIERPONT BLVD | 32 |
| FOOTHILL RD | 30 |
| NB 101 SO | 30 |
| NB 33 AT | 28 |
| SB 33 AT | 28 |
| THOMAS FIRE | 28 |
| NORTH BANK DR | 26 |
| SARATOGA AVE | 26 |
| SB 101 NO | 26 |
| KIMBALL RD | 24 |
| SANJON RD | 24 |
| Other | 687 |
2005 - 2018 National Fire Incident Reporting System (NFIRS) incidents
- Incident types reported to NFIRS in Ventura, CA
- 33,99471.5%Rescue & EMS
- 6,48113.6%Good Intent Call
- 2,3925.0%Service Call
- 2,3254.9%Fire
- 1,2562.6%False Alarm
- 1,0052.1%Hazardous Condition
- Fire incident types reported to NFIRS in Ventura, CA
- 1,03444.5%Outside Fires
- 86537.2%Structure Fires
- 30413.1%Mobile Property/Vehicle Fires
- 1225.2%Other
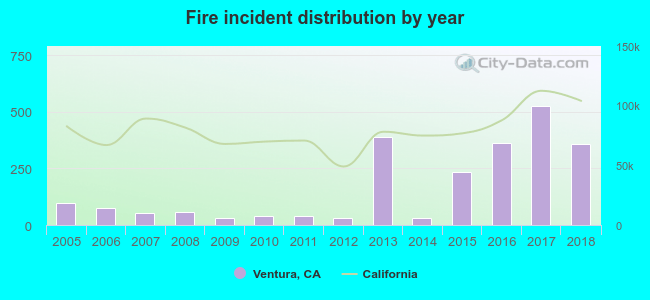 According to the data from the years 2005 - 2018 the average number of fire incidents per year is 166. The highest number of fire incidents - 527 took place in 2017, and the least - 31 in 2012. The data has an increasing trend.
The average number of yearly fire incidents per 10k residents in Ventura, CA compared to nearest cities:
(Note: Based on data for the last 3 years, including only cities with population 5,000 and above)
| Ventura: | 37.4 |
| El Rio: | 43.5 |
| Oxnard: | 24.6 |
| Port Hueneme: | 26.3 |
| Mira Monte: | 4.4 |
| Santa Paula: | 24.2 |
| Ojai: | 47.6 |
| Camarillo: | 17.4 |
| Carpinteria: | 21.2 |
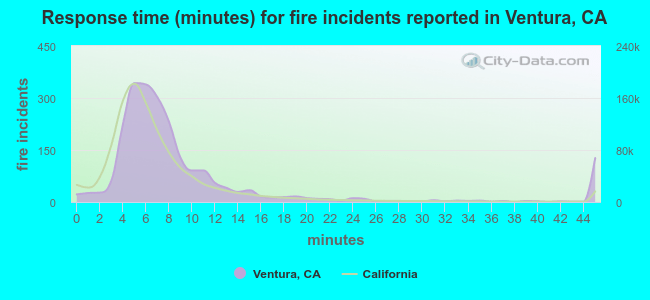 The median response time based on all reported fire incidents is 7 minutes. This is about the same as the state median value.
The median response time in Ventura, CA compared to nearest cities:
(Note: Based on data for all years, including only cities with at least 500 fire incidents)
| Ventura: | 7 minutes |
| Oxnard: | 5 minutes |
| Port Hueneme: | 6 minutes |
| Santa Paula: | 6 minutes |
| Camarillo: | 6 minutes |
| Moorpark: | 7 minutes |
| Thousand Oaks: | 6 minutes |
| Simi Valley: | 6 minutes |
| Santa Barbara: | 5 minutes |
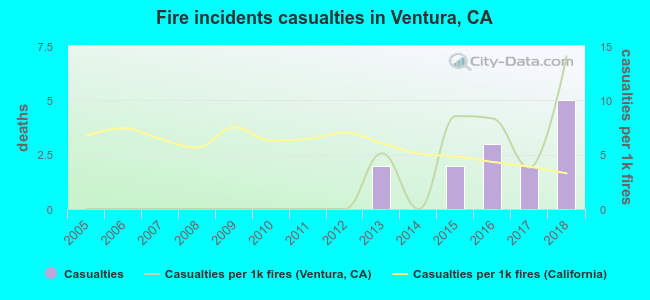 Based on the data from the years 2005 - 2018 the average number of fire-related casualties per year is 1. The highest number of casualties - 5 took place in 2018, and the lowest - 0 in 2005. The data has a rising trend.
The average number of injuries per 1,000 fire incidents is 3. This indicator was the highest - 14 in 2018, and the lowest 0 in 2005. The trend for casualties per 1,000 fires is increasing. Compared to the state value the number of casualties per 1,000 incidents is similar.
Based on the data from the years 2005 - 2018 the average number of fire-related casualties per year is 1. The highest number of casualties - 5 took place in 2018, and the lowest - 0 in 2005. The data has a rising trend.
The average number of injuries per 1,000 fire incidents is 3. This indicator was the highest - 14 in 2018, and the lowest 0 in 2005. The trend for casualties per 1,000 fires is increasing. Compared to the state value the number of casualties per 1,000 incidents is similar.Casualties per 1,000 incidents in Ventura, CA compared to nearest cities:
(Note: Based on data for all years, including only cities with at least 500 fire incidents)
| Ventura: | 6.0 |
| Oxnard: | 5.6 |
| Port Hueneme: | 6.6 |
| Santa Paula: | 6.3 |
| Camarillo: | 4.1 |
| Moorpark: | 2.9 |
| Thousand Oaks: | 9.8 |
| Simi Valley: | 7.5 |
| Santa Barbara: | 4.8 |
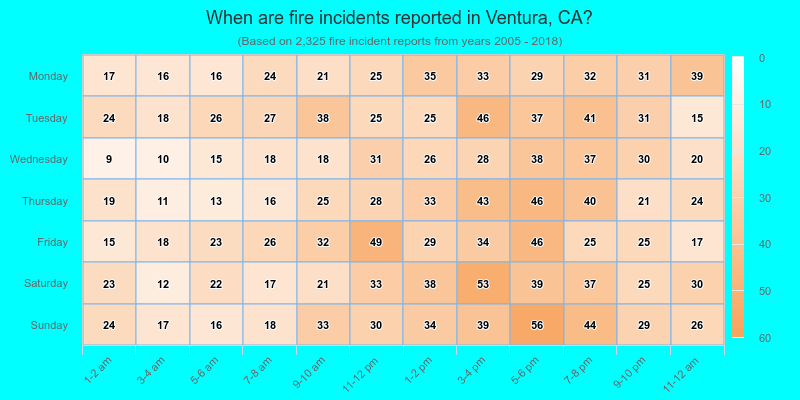
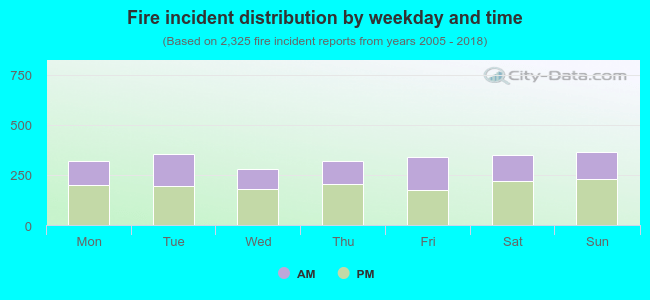 39.5% incidents where reported in the morning and 60.5% in the evening. The most fires (15.7%) took place on Sunday, and the least (12.0%) on Wednesday.
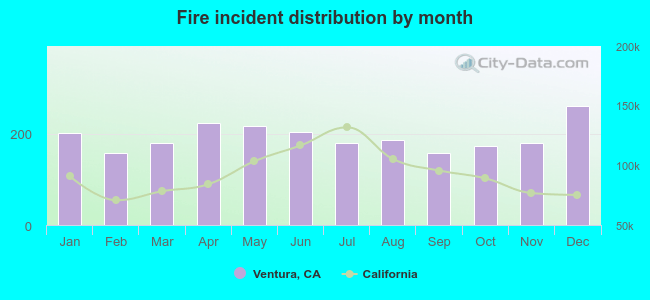 According to the 2,325 fire incidents from years 2005 - 2018 most fires (11.3%) took place during December, and the least (6.8%) in February.
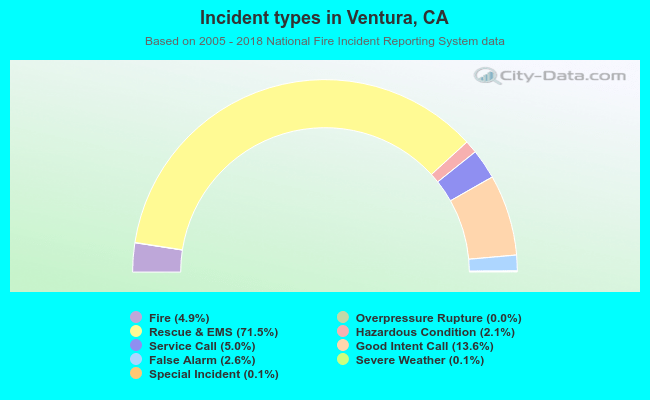 Out of all 47,537 cases reported during the years 2005 - 2018, the most belonged to the categories: Rescue & EMS (71.5%), Good Intent Call (13.6%), and Service Call (5.0%).
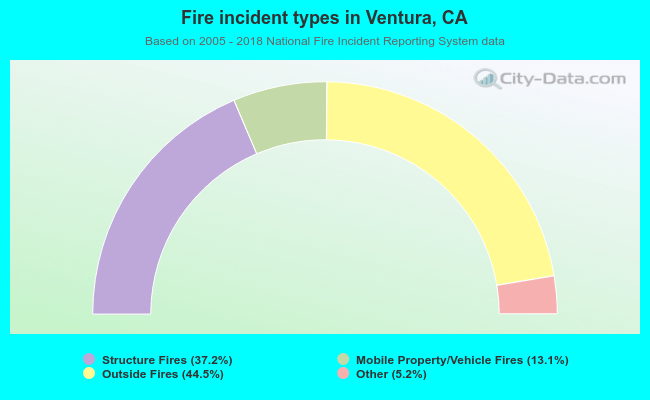 When looking into fire subcategories, the most incidents belonged to: Outside Fires (44.5%), and Structure Fires (37.2%).