Verdi: Fire Incidents, Nevada (NV)
Where are fire incidents reported in Verdi, NV
Something went wrong! Please refresh the page.
|
| |||||||||||||||||||||||||||||||||||||||||||||||||||||||||||||||||||||||||||||||||||||||||||||||||||||||||||||
| Other | 3 | |||||||||||||||||||||||||||||||||||||||||||||||||||||||||||||||||||||||||||||||||||||||||||||||||||||||||||||
2003 - 2018 National Fire Incident Reporting System (NFIRS) incidents
- Incident types reported to NFIRS in Verdi, NV
- 49344.9%Rescue & EMS
- 20518.7%Good Intent Call
- 19117.4%Fire
- 847.7%Service Call
- 706.4%Hazardous Condition
- 524.7%False Alarm
- 20.2%Special Incident
- Fire incident types reported to NFIRS in Verdi, NV
- 10756.0%Outside Fires
- 3920.4%Structure Fires
- 3920.4%Mobile Property/Vehicle Fires
- 63.1%Other
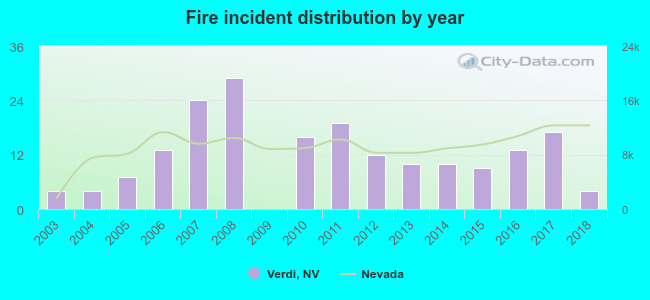 According to the data from the years 2003 - 2018 the average number of fires per year is 12. The highest number of fires - 29 took place in 2008, and the least - 0 in 2009. The data has a constant trend.
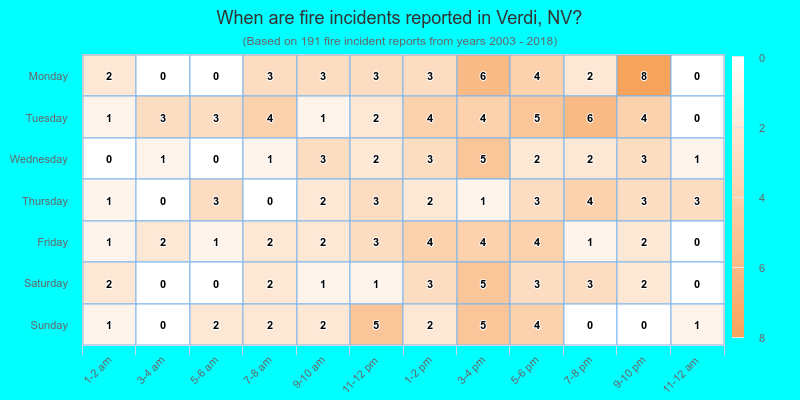
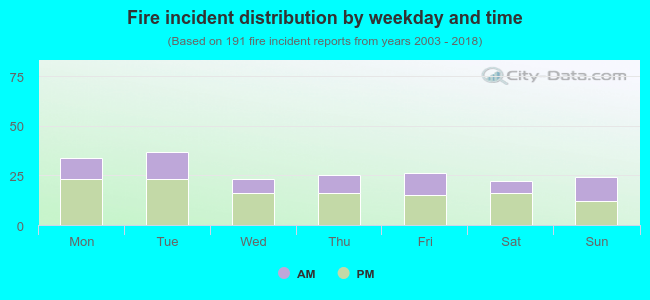 36.6% incidents where reported in the morning and 63.4% in the evening. The most fires (19.4%) took place on Tuesday, and the least (11.5%) on Saturday.
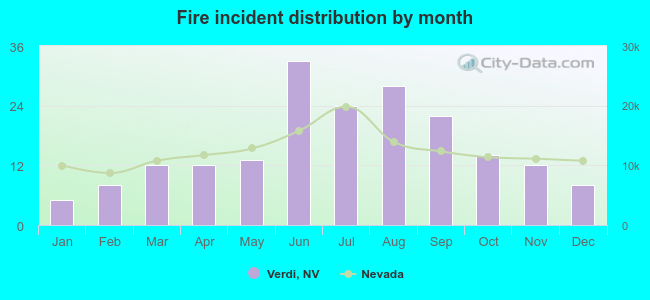 Based on the 191 fires from years 2003 - 2018 most fires (17.3%) took place during June, and the least (2.6%) in January.
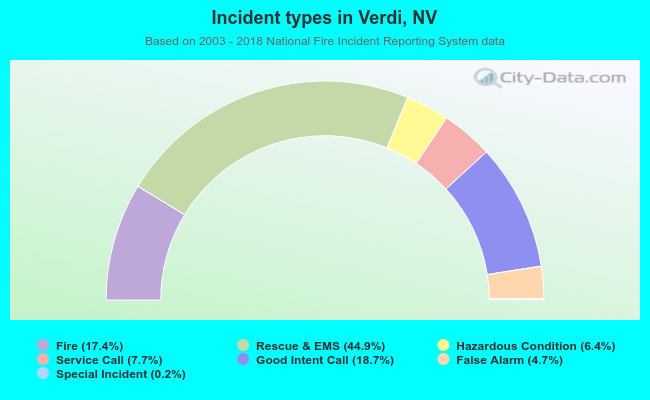 Out of all 1,097 cases reported during the years 2003 - 2018, the most belonged to the categories: Overpressure Rupture (44.9%), Service Call (18.7%), and Fire (17.4%).
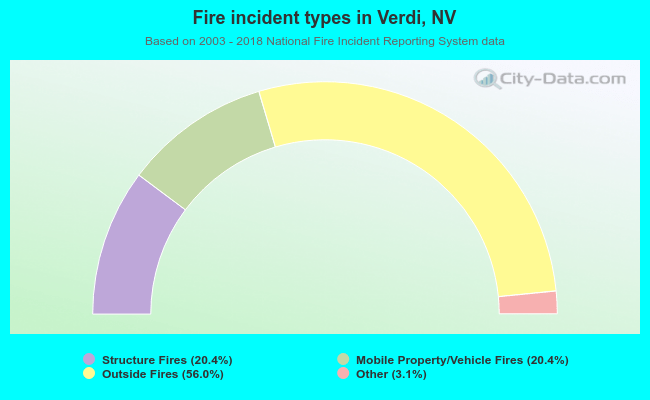 When looking into fire subcategories, the most reports belonged to: Outside Fires (56.0%), and Structure Fires (20.4%).