Vineland: Fire Incidents, New Jersey (NJ)
Where are fire incidents reported in Vineland, NJ
Something went wrong! Please refresh the page.
| Fire incidents reported | |
|---|---|
| Sreet name | Count |
| DELSEA DR | 650 |
| LANDIS AVE | 616 |
| CHESTNUT AVE | 372 |
| MAIN RD | 292 |
| ROUTE 55 | 240 |
| EAST AVE | 198 |
| WALNUT RD | 188 |
| WEST BLVD | 148 |
| PARK AVE | 144 |
| OAK RD | 120 |
| LINCOLN AVE | 114 |
| WEST AVE | 114 |
| EAST BLVD | 112 |
| MAYS LANDING RD | 112 |
| MILL RD | 112 |
| SHERMAN AVE | 110 |
| ORCHARD RD | 80 |
| 7TH ST | 78 |
| ALMOND RD | 74 |
| WHEAT RD | 70 |
| ELMER ST | 66 |
| GARDEN RD | 64 |
| AXTELL AVE | 60 |
| GRAPE ST | 60 |
| PLUM ST | 60 |
| ELMER RD | 58 |
| 6TH ST | 56 |
| MAPLE AVE | 52 |
| SPRING RD | 52 |
| VALLEY AVE | 52 |
2002 - 2018 National Fire Incident Reporting System (NFIRS) incidents
- Incident types reported to NFIRS in Vineland, NJ
- 5,57334.3%Hazardous Condition
- 3,89824.0%Fire
- 3,82723.5%False Alarm
- 1,1897.3%Good Intent Call
- 9585.9%Rescue & EMS
- 7504.6%Service Call
- 400.2%Overpressure Rupture
- 230.1%Severe Weather
- Fire incident types reported to NFIRS in Vineland, NJ
- 1,73344.5%Structure Fires
- 1,38935.6%Outside Fires
- 75919.5%Mobile Property/Vehicle Fires
- 170.4%Other
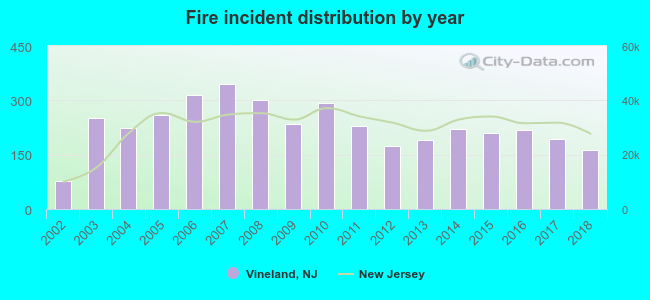 Based on the data from the years 2002 - 2018 the average number of fire incidents per year is 229. The highest number of reported fire incidents - 345 took place in 2007, and the least - 77 in 2002. The data has a rising trend.
The average number of yearly fire incidents per 10k residents in Vineland, NJ compared to nearest cities:
(Note: Based on data for the last 3 years, including only cities with population 5,000 and above)
| Vineland: | 31.3 |
| Millville: | 48.9 |
| Bridgeton: | 51.6 |
| Clayton: | 9.6 |
| Williamstown: | 24.6 |
| Hammonton: | 35.2 |
| Glassboro: | 55.6 |
| Pitman: | 48.3 |
| Pine Hill: | 69.8 |
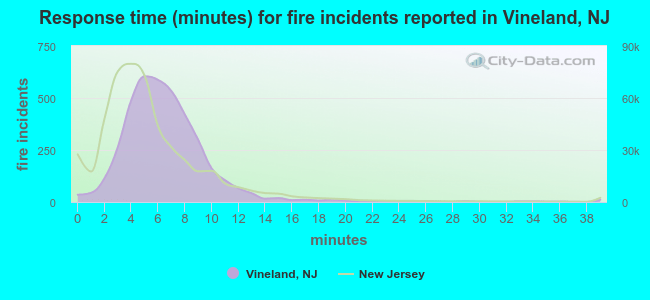 The median response time based on all reported fire incidents is 6 minutes. This is similar to the state median value.
The median response time in Vineland, NJ compared to nearest cities:
(Note: Based on data for all years, including only cities with at least 500 fire incidents)
| Vineland: | 6 minutes |
| Millville: | 6 minutes |
| Bridgeton: | 5 minutes |
| Williamstown: | 8 minutes |
| Mays Landing: | 6 minutes |
| Hammonton: | 7 minutes |
| Glassboro: | 5 minutes |
| Turnersville: | 7 minutes |
| Mullica Hill: | 9 minutes |
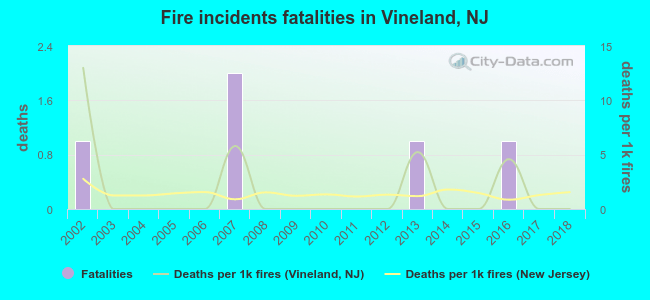 Based on the reports from the years 2002 - 2018 the average number of fire-related fatalities per year is 0. The highest number of deaths - 2 took place in 2007, and the lowest - 0 in 2003. The data has a decreasing trend.
The average number of deaths per 1,000 fire incidents is 2. This indicator was the highest - 13 in 2002, and the lowest 0 in 2003. The trend for fatalities per 1,000 fires is declining. Compared to the state value the number of deaths per 1,000 fire incidents is similar.
Based on the reports from the years 2002 - 2018 the average number of fire-related fatalities per year is 0. The highest number of deaths - 2 took place in 2007, and the lowest - 0 in 2003. The data has a decreasing trend.
The average number of deaths per 1,000 fire incidents is 2. This indicator was the highest - 13 in 2002, and the lowest 0 in 2003. The trend for fatalities per 1,000 fires is declining. Compared to the state value the number of deaths per 1,000 fire incidents is similar.Deaths per 1,000 incidents in Vineland, NJ compared to nearest cities:
(Note: Based on data for all years, including only cities with at least 2,500 fire incidents)
| Vineland: | 1.3 |
| Bridgeton: | 2.5 |
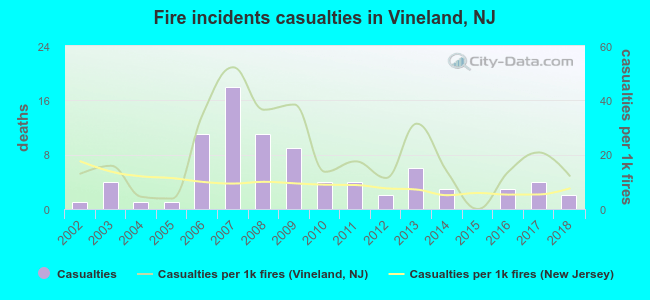 Based on the reports from the years 2002 - 2018 the average number of fire-related casualties per year is 5. The highest number of reported injuries - 18 took place in 2007, and the lowest - 0 in 2015. The data has a rising trend.
The average number of injuries per 1,000 fires is 20. This indicator was the highest - 52 in 2007, and the lowest 0 in 2015. The trend for casualties per 1,000 fires is dropping. Compared to the New Jersey value the number of injuries per 1,000 fire incidents is much higher.
Based on the reports from the years 2002 - 2018 the average number of fire-related casualties per year is 5. The highest number of reported injuries - 18 took place in 2007, and the lowest - 0 in 2015. The data has a rising trend.
The average number of injuries per 1,000 fires is 20. This indicator was the highest - 52 in 2007, and the lowest 0 in 2015. The trend for casualties per 1,000 fires is dropping. Compared to the New Jersey value the number of injuries per 1,000 fire incidents is much higher.Casualties per 1,000 incidents in Vineland, NJ compared to nearest cities:
(Note: Based on data for all years, including only cities with at least 500 fire incidents)
| Vineland: | 21.5 |
| Millville: | 10.9 |
| Bridgeton: | 14.8 |
| Williamstown: | 18.2 |
| Mays Landing: | 1.8 |
| Hammonton: | 5.4 |
| Glassboro: | 0.8 |
| Turnersville: | 13.6 |
| Mullica Hill: | 1.8 |
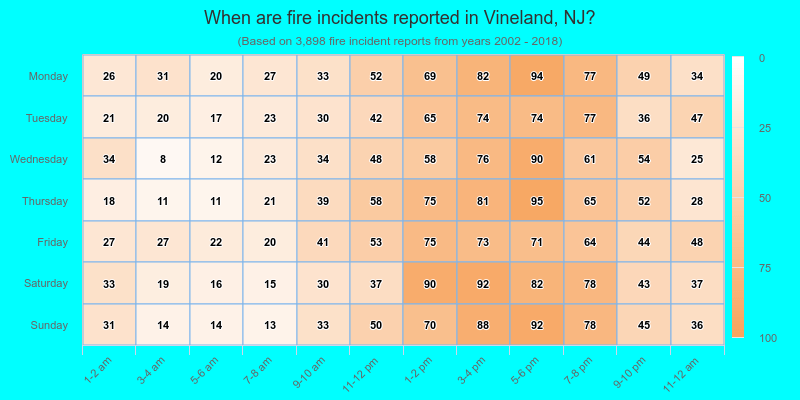
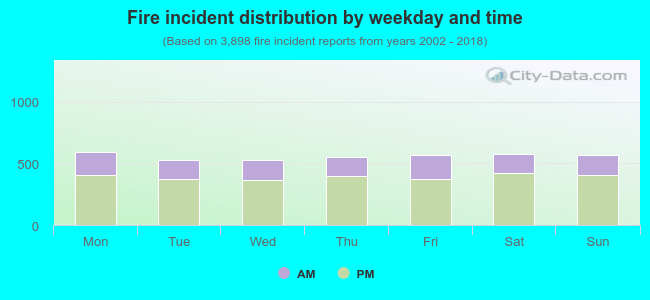 29.6% incidents where reported in the morning and 70.4% in the evening. The most fires (15.2%) took place on Monday, and the least (13.4%) on Wednesday.
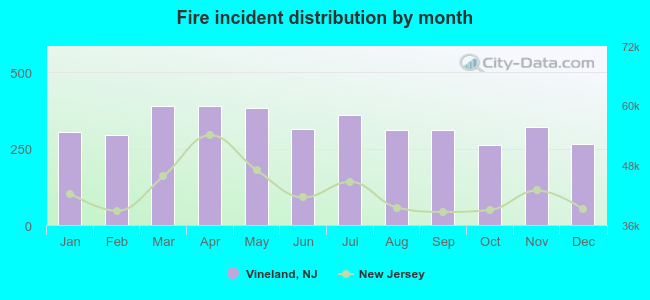 Based on the 3,898 reports from years 2002 - 2018 most fires (10.0%) took place during March, and the least (6.7%) in October.
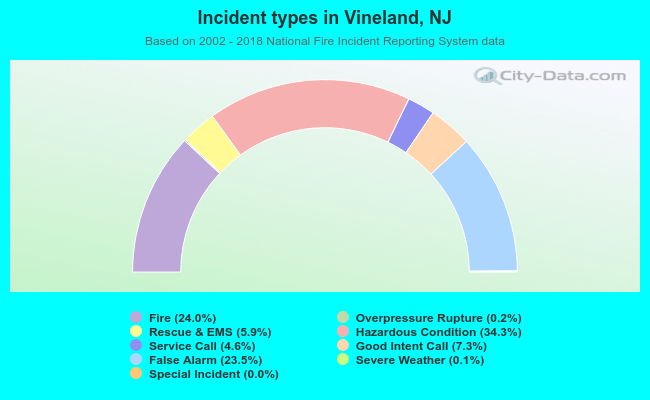 Out of all 16,263 cases reported during the years 2002 - 2018, the most belonged to the categories: Hazardous Condition (34.3%), Fire (24.0%), and False Alarm (23.5%).
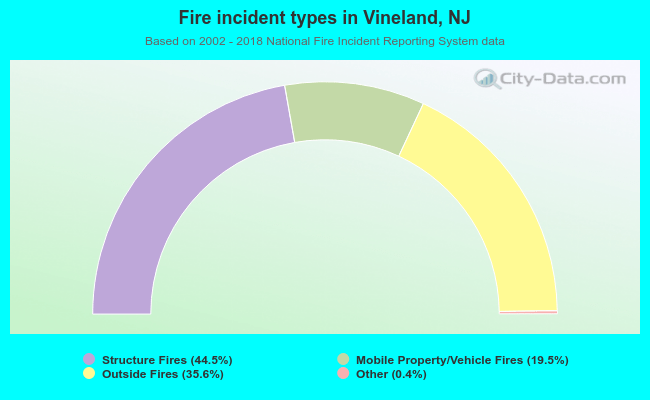 When looking into fire subcategories, the most reports belonged to: Structure Fires (44.5%), and Outside Fires (35.6%).