| Fire incidents reported |
|---|
| Sreet name | Count |
|---|
| 620 GARFIELD AVE | 16 | | CHERRY GROVE RD | 10 | | COUNTY ROAD LF | 8 | | 200 PARK VIEW COURT | 6 | | 507 SOUTH MAIN | 6 | | COUNTY N | 6 | | MAIN ST | 6 | | S 6266A | 6 | | 1133 N MAIN | 4 | | 200 BIGLEY PLAZA | 4 | | 200 PARK VEIW CT | 4 | | 200 PARKVEIW COURT | 4 | | 620 SOUTH GARFIELD | 4 | | 703 RAILROAD AVE. | 4 | | COUNTY ROAD NN | 4 | | COUNTY ROAD T | 4 | | DECKER ST | 4 | | E7513 | 4 | | E7716 CHERRY GROVE RD | 4 | | MAIN & DECKER | 4 | | NORTH MAIN | 4 | | S7588 HWY 27 | 4 | | SIDIE HOLLOW RD S OF FREDRICKS | 4 | | WOODLAND RD | 4 | | 1 SANDY OAK DR | 2 |
| | | Fire incidents reported |
|---|
| Sreet name | Count |
|---|
| 100 BLACKHAWK DR. | 2 | | 100 BLACKHAWK DRIVE | 2 | | 100 S. MAIN | 2 | | 1002 N. MAIN | 2 | | 1007 N MAIN | 2 | | 102 N. MAIN | 2 | | 102 NORTH MAIN STREET | 2 | | 107 S DUNLAP | 2 | | 108 PARKWOOD DRIVE | 2 | | 113 N MAIN | 2 | | 113 N. MAIN | 2 | | 113 S MAIN | 2 | | 1133 N. MAIN | 2 | | 1133N MAIN | 2 | | 115 1/2 S. MAIN | 2 | | 116 E MAPLE STREET | 2 | | 118 WILLOW ST | 2 | | 1200 EAST DECKER | 2 | | 1201 N MAIN | 2 | | 1202 NELSON PARKWAY | 2 | | 1202 EAST POWER DDRIVE | 2 | | 1202 NELSON PARKWAY | 2 | | 121 WEST MAPLE | 2 | | 1214 N MAIN | 2 | | |
|
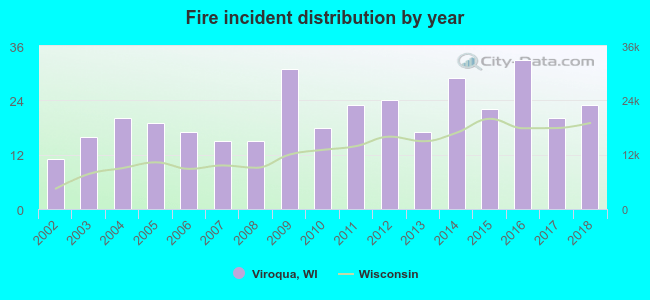 Based on the data from the years 2002 - 2018 the average number of fire incidents per year is 21. The highest number of reported fire incidents - 33 took place in 2016, and the least - 11 in 2002. The data has an increasing trend.
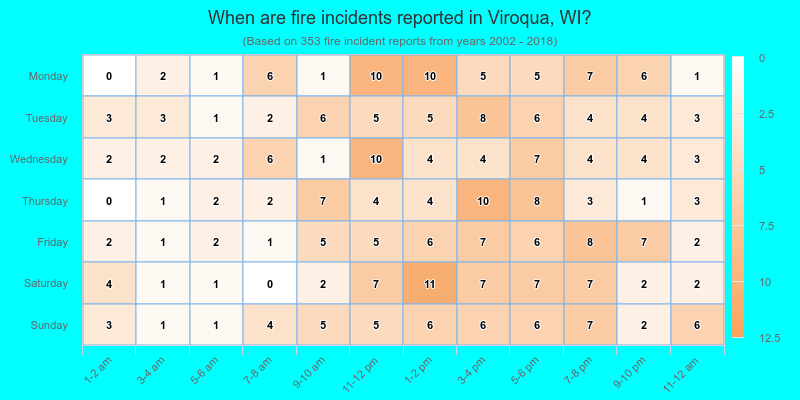
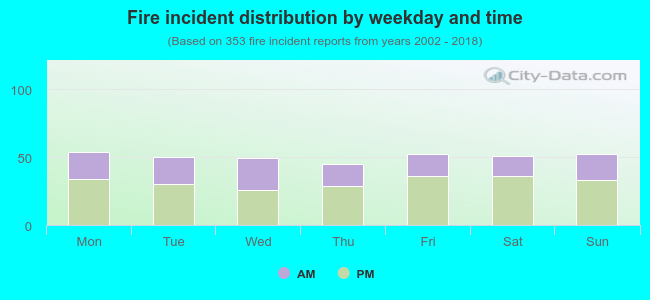 36.5% incidents where reported in the morning and 63.5% in the evening. The most fires (15.3%) took place on Monday, and the least (12.7%) on Thursday.
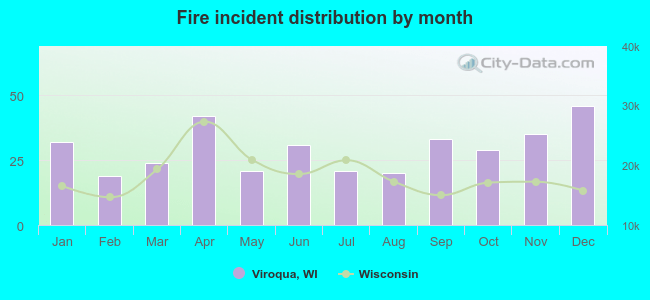 Based on the 353 fires from years 2002 - 2018 most fires (13.0%) took place during December, and the least (5.4%) in February.
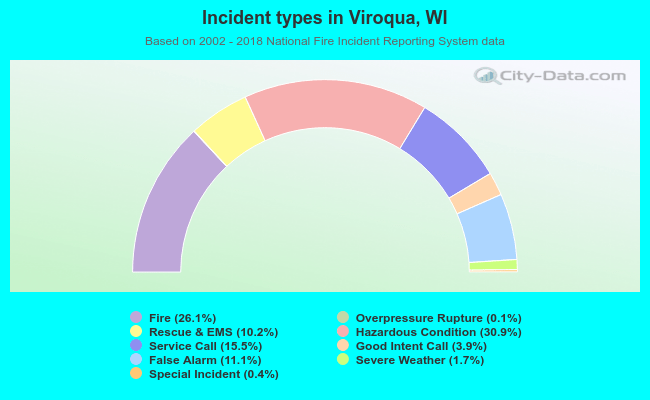 Out of all 1,351 cases reported during the years 2002 - 2018, the most belonged to the categories: Hazardous Condition (30.9%), Fire (26.1%), and Service Call (15.5%).
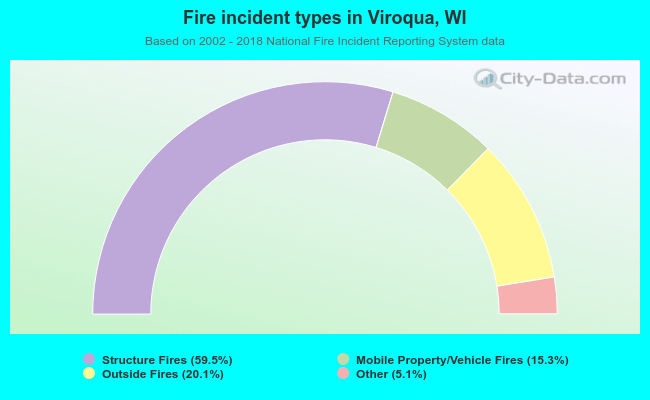 When looking into fire subcategories, the most incidents belonged to: Structure Fires (59.5%), and Outside Fires (20.1%).