WaKeeney: Fire Incidents, Kansas (KS)
Where are fire incidents reported in WaKeeney, KS
Something went wrong! Please refresh the page.
|
| |||||||||||||||||||||||||||||||||||||||||||||||||||||||||||||||||||||||||||||||||||||||||||||||||||||||||||||
| Other | 141 | |||||||||||||||||||||||||||||||||||||||||||||||||||||||||||||||||||||||||||||||||||||||||||||||||||||||||||||
2002 - 2018 National Fire Incident Reporting System (NFIRS) incidents
- Incident types reported to NFIRS in WaKeeney, KS
- 39576.8%Fire
- 489.3%Rescue & EMS
- 407.8%Hazardous Condition
- 183.5%False Alarm
- 51.0%Good Intent Call
- 40.8%Service Call
- 20.4%Overpressure Rupture
- 20.4%Severe Weather
- Fire incident types reported to NFIRS in WaKeeney, KS
- 26065.8%Outside Fires
- 8020.3%Mobile Property/Vehicle Fires
- 5012.7%Structure Fires
- 51.3%Other
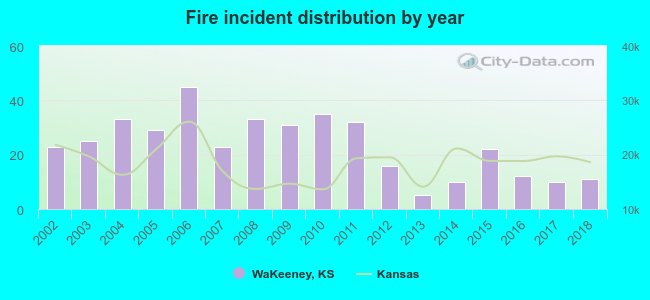 Based on the data from the years 2002 - 2018 the average number of fire incidents per year is 23. The highest number of fires - 45 took place in 2006, and the least - 5 in 2013. The data has a dropping trend.
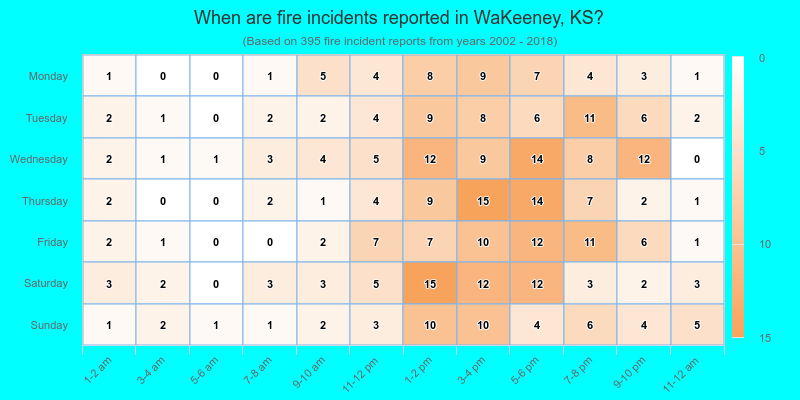
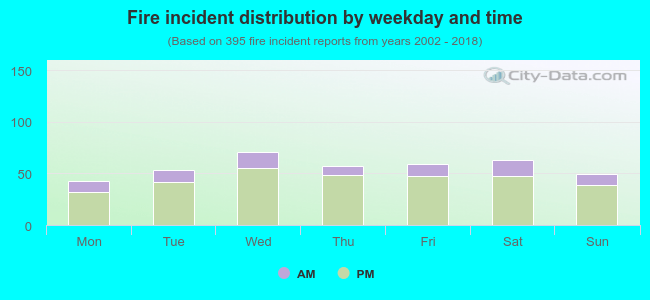 21.5% incidents where reported in the morning and 78.5% in the evening. The most fires (18.0%) took place on Wednesday, and the least (10.9%) on Monday.
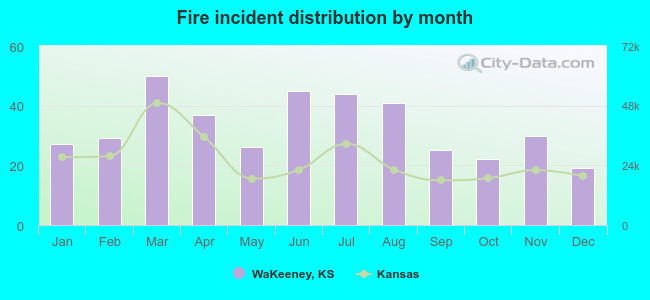 According to the 395 fires from years 2002 - 2018 most fires (12.7%) took place during March, and the least (4.8%) in December.
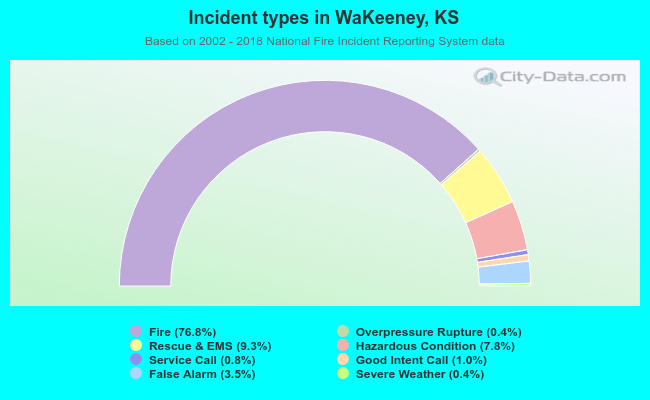 Out of all 514 cases reported during the years 2002 - 2018, the most belonged to the categories: Fire (76.8%), Rescue & EMS (9.3%), and Hazardous Condition (7.8%).
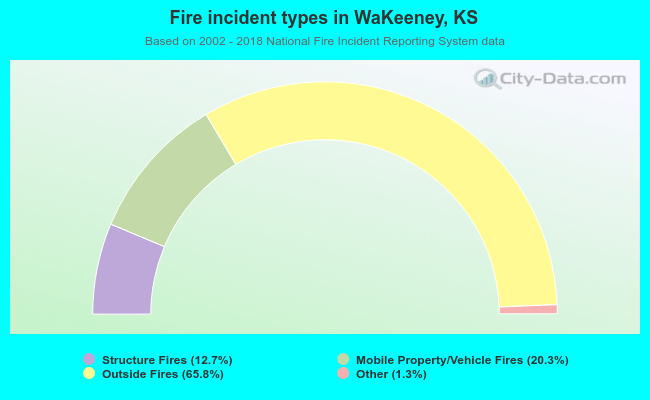 When looking into fire subcategories, the most incidents belonged to: Outside Fires (65.8%), and Mobile Property/Vehicle Fires (20.3%).