Walkerton: Fire Incidents, Indiana (IN)
Where are fire incidents reported in Walkerton, IN
Something went wrong! Please refresh the page.
|
| |||||||||||||||||||||||||||||||||||||||||||||||||||||||||||||||||||||||||||||||||||||||||||||||||||||||||||||
| Other | 129 | |||||||||||||||||||||||||||||||||||||||||||||||||||||||||||||||||||||||||||||||||||||||||||||||||||||||||||||
2002 - 2018 National Fire Incident Reporting System (NFIRS) incidents
- Incident types reported to NFIRS in Walkerton, IN
- 1,06537.4%Rescue & EMS
- 98734.7%Fire
- 39513.9%Hazardous Condition
- 1595.6%Good Intent Call
- 1234.3%Service Call
- 903.2%False Alarm
- 190.7%Special Incident
- 60.2%Severe Weather
- 30.1%Overpressure Rupture
- Fire incident types reported to NFIRS in Walkerton, IN
- 46947.5%Outside Fires
- 36937.4%Structure Fires
- 11211.3%Mobile Property/Vehicle Fires
- 373.7%Other
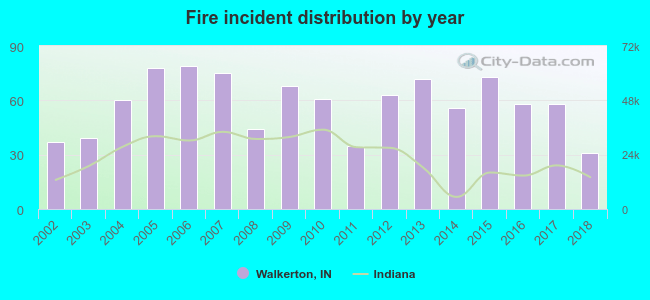 According to the data from the years 2002 - 2018 the average number of fires per year is 58. The highest number of fires - 79 took place in 2006, and the least - 31 in 2018. The data has a dropping trend.
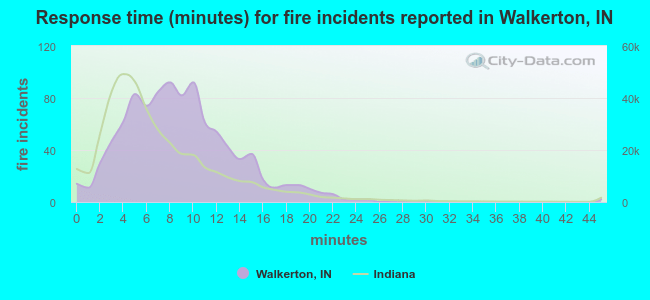 The median response time based on all reported fire incidents is 8 minutes. This is higher than the state median value.
The median response time in Walkerton, IN compared to nearest cities:
(Note: Based on data for all years, including only cities with at least 500 fire incidents)
| Walkerton: | 8 minutes |
| Plymouth: | 8 minutes |
| Knox: | 7 minutes |
| La Porte: | 3 minutes |
| South Bend: | 5 minutes |
| Notre Dame: | 2 minutes |
| Mishawaka: | 5 minutes |
| North Judson: | 0 minutes |
| Nappanee: | 6 minutes |
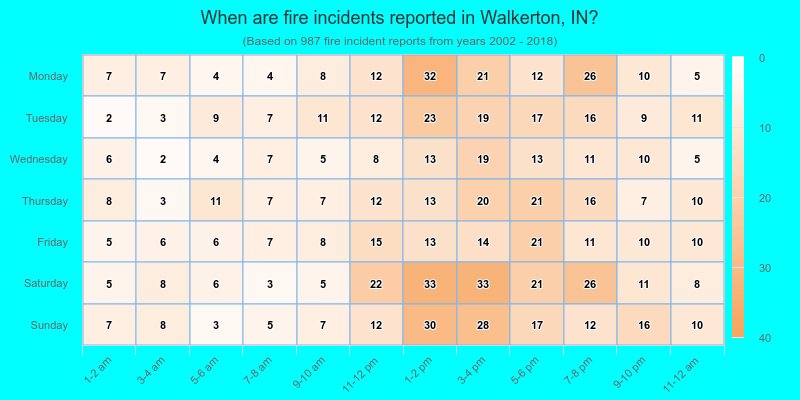
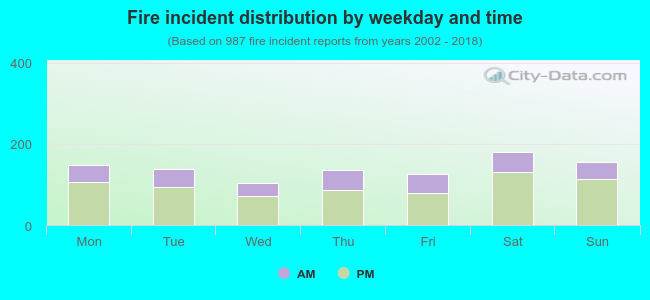 30.8% incidents where reported in the morning and 69.2% in the evening. The most fires (18.3%) took place on Saturday, and the least (10.4%) on Wednesday.
 According to the 987 reports from years 2002 - 2018 most fires (23.5%) took place during April, and the least (4.4%) in January.
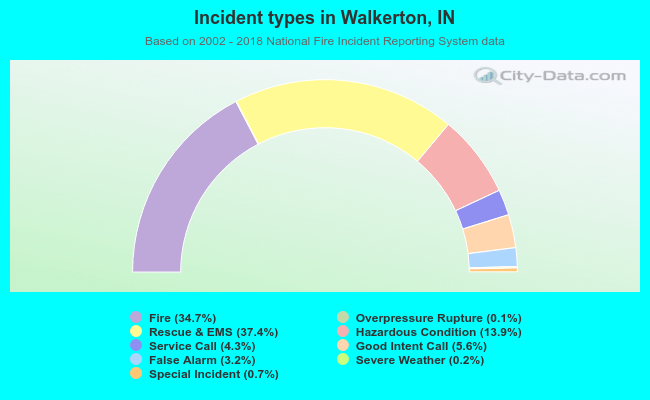 Out of all 2,847 cases reported during the years 2002 - 2018, the most belonged to the categories: Rescue & EMS (37.4%), Fire (34.7%), and Hazardous Condition (13.9%).
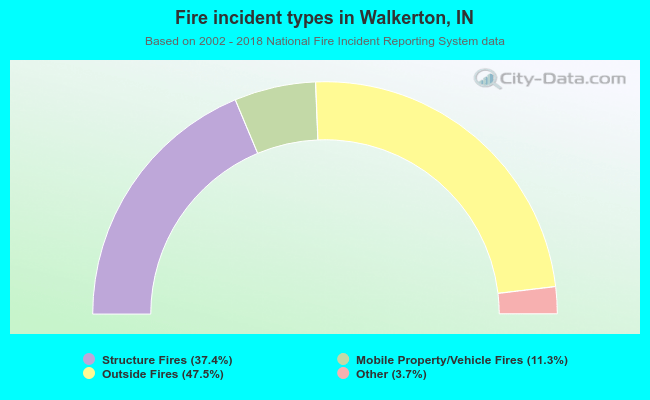 When looking into fire subcategories, the most reports belonged to: Outside Fires (47.5%), and Structure Fires (37.4%).