Warsaw: Fire Incidents, Indiana (IN)
Where are fire incidents reported in Warsaw, IN
Something went wrong! Please refresh the page.
| Fire incidents reported | |
|---|---|
| Sreet name | Count |
| CENTER ST | 122 |
| WINONA AVE | 106 |
| COLFAX ST | 88 |
| DETROIT ST | 86 |
| MARKET ST | 78 |
| BUFFALO ST | 64 |
| COUNTRY CLUB RD | 54 |
| 200 RD | 52 |
| LAKE CITY HWY | 48 |
| 250 CR | 46 |
| JEFFERSON ST | 46 |
| LAKE ST | 44 |
| U.S. 30 HWY | 42 |
| COUNTY FARM RD | 36 |
| HUSKY TRAIL | 36 |
| 300 CR | 32 |
| FOX FARM RD | 32 |
| WOOSTER RD | 32 |
| 100 CR | 30 |
| ANCHORAGE RD | 30 |
| FORT WAYNE ST | 30 |
| WASHINGTON ST | 30 |
| 200 CR | 28 |
| MAIN ST | 28 |
| ROSEMONT AVE | 28 |
| SR 15 HWY | 28 |
| COLUMBIA ST | 26 |
| OLD RD 30 | 26 |
| PACKERTON RD | 26 |
| SMITH ST | 26 |
| Other | 533 |
2003 - 2017 National Fire Incident Reporting System (NFIRS) incidents
- Incident types reported to NFIRS in Warsaw, IN
- 3,69739.7%Rescue & EMS
- 2,37025.5%Hazardous Condition
- 1,91320.6%Fire
- 5165.5%Good Intent Call
- 5085.5%False Alarm
- 2262.4%Service Call
- 370.4%Overpressure Rupture
- 290.3%Special Incident
- 120.1%Severe Weather
- Fire incident types reported to NFIRS in Warsaw, IN
- 83343.5%Outside Fires
- 72137.7%Structure Fires
- 24212.7%Mobile Property/Vehicle Fires
- 1176.1%Other
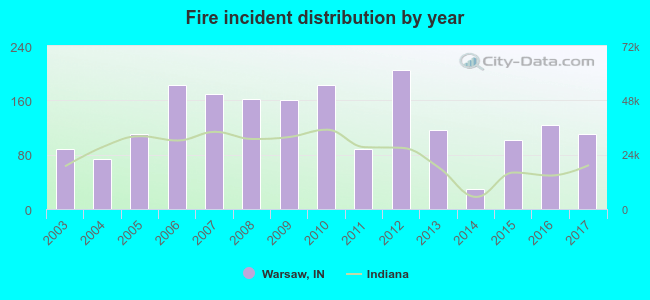 Based on the data from the years 2003 - 2017 the average number of fire incidents per year is 127. The highest number of fire incidents - 205 took place in 2012, and the least - 29 in 2014. The data has an increasing trend.
The average number of yearly fire incidents per 10k residents in Warsaw, IN compared to nearest cities:
(Note: Based on data for the last 3 years, including only cities with population 5,000 and above)
| Warsaw: | 55.3 |
| Nappanee: | 37.2 |
| North Manchester: | 45.1 |
| Columbia City: | 56.6 |
| Rochester: | 82.8 |
| Goshen: | 26.1 |
| Plymouth: | 24.4 |
| Wabash: | 40.9 |
| Huntington: | 30.9 |
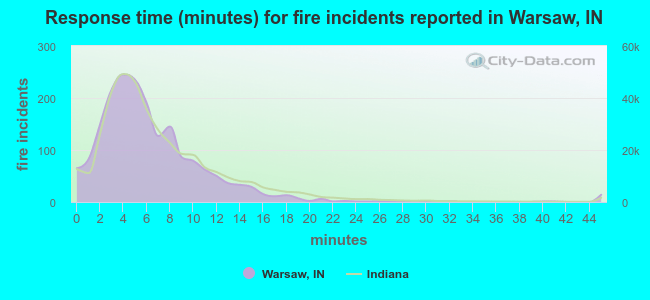 The median response time based on all reported fire incidents is 5 minutes. This is lower than the Indiana median value.
The median response time in Warsaw, IN compared to nearest cities:
(Note: Based on data for all years, including only cities with at least 500 fire incidents)
| Warsaw: | 5 minutes |
| Pierceton: | 7 minutes |
| Syracuse: | 7 minutes |
| Nappanee: | 6 minutes |
| North Manchester: | 6 minutes |
| Columbia City: | 7 minutes |
| Ligonier: | 8 minutes |
| Rochester: | 8 minutes |
| Goshen: | 6 minutes |
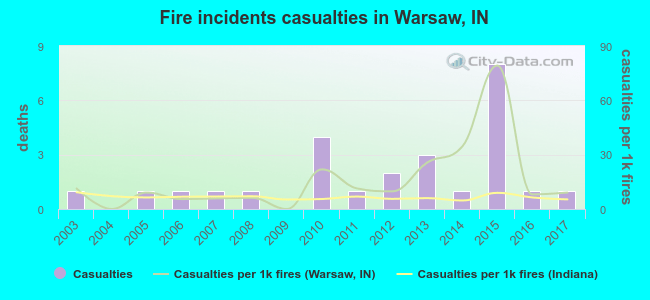 According to the reports from the years 2003 - 2017 the average number of fire-related yearly casualties is 2. The highest number of reported casualties - 8 took place in 2015, and the lowest - 0 in 2004. The data has a constant trend.
The average number of injuries per 1,000 fires is 16. This indicator was the highest - 79 in 2015, and the lowest 0 in 2004. The trend for injuries per 1,000 fire incidents is decreasing. Compared to the state value the number of injuries per 1,000 fires is much higher.
According to the reports from the years 2003 - 2017 the average number of fire-related yearly casualties is 2. The highest number of reported casualties - 8 took place in 2015, and the lowest - 0 in 2004. The data has a constant trend.
The average number of injuries per 1,000 fires is 16. This indicator was the highest - 79 in 2015, and the lowest 0 in 2004. The trend for injuries per 1,000 fire incidents is decreasing. Compared to the state value the number of injuries per 1,000 fires is much higher.Casualties per 1,000 incidents in Warsaw, IN compared to nearest cities:
(Note: Based on data for all years, including only cities with at least 500 fire incidents)
| Warsaw: | 13.6 |
| Pierceton: | 1.4 |
| Syracuse: | 4.9 |
| Nappanee: | 18.1 |
| North Manchester: | 2.0 |
| Columbia City: | 0.6 |
| Ligonier: | 8.5 |
| Rochester: | 3.6 |
| Goshen: | 7.3 |
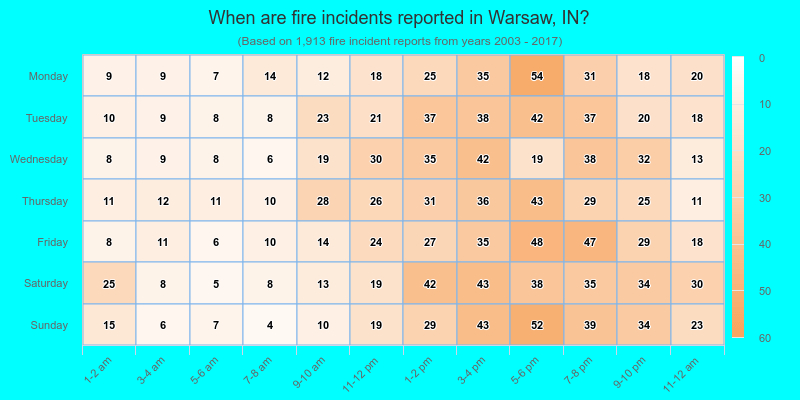
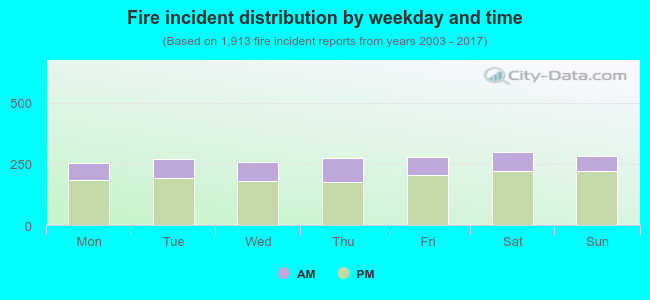 28.1% incidents where reported in the morning and 71.9% in the evening. The most fires (15.7%) took place on Saturday, and the least (13.2%) on Monday.
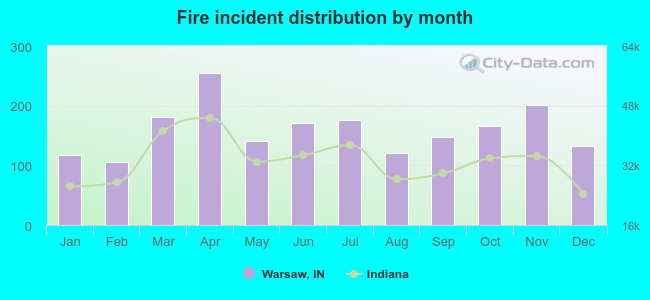 Based on the 1,913 fire incident reports from years 2003 - 2017 most fires (13.3%) took place during April, and the least (5.5%) in February.
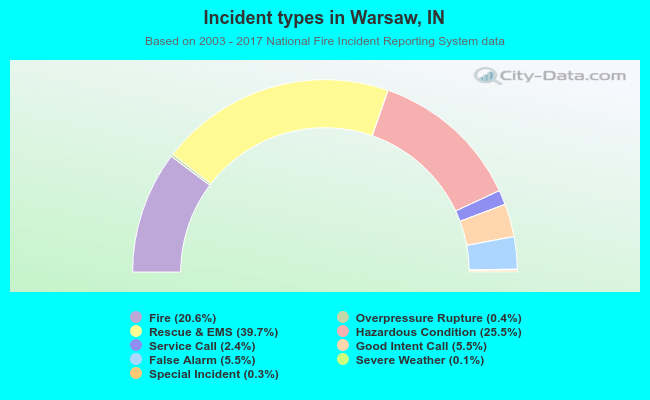 Out of all 9,308 cases reported during the years 2003 - 2017, the most belonged to the categories: Rescue & EMS (39.7%), Hazardous Condition (25.5%), and Fire (20.6%).
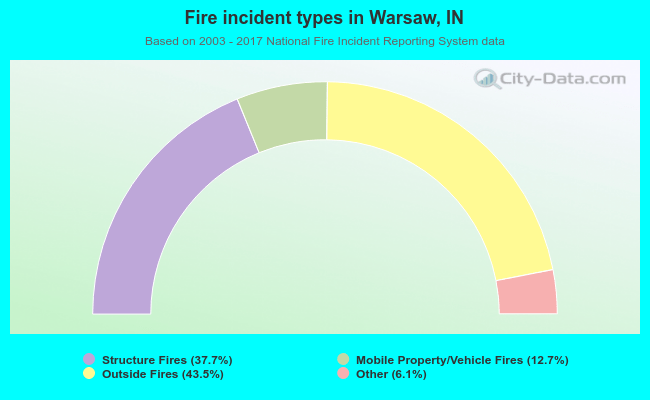 When looking into fire subcategories, the most reports belonged to: Outside Fires (43.5%), and Structure Fires (37.7%).